Bitcoin’s Make-or-Break Moment: Can It Defend $106K and $98K Support?

Crypto's bellwether asset faces a critical stress test—failure to hold these levels could trigger a cascade.
The $106K Line in the Sand
Bitcoin bulls are sweating as the king coin flirts with a precipice. Two key support zones—$106,000 and $98,000—now stand between stability and a full-blown technical breakdown. Lose these, and even the diamond hands might start itching for the sell button.
Why These Numbers Matter
Market psychology meets hard math here. These aren't arbitrary round numbers—they're liquidity magnets where algorithmic traders and institutional whales place their bets. A decisive close below $98K? That's when the 'buy the dip' crowd starts eyeing exit strategies.
The Silver Lining (For Optimists)
History shows Bitcoin loves nothing more than proving doomsayers wrong. Each major correction has—eventually—been a springboard to new highs. Then again, past performance doesn't guarantee future results—just ask your local bagholder from the 2021 cycle.
Wall Street's watching. Retail's sweating. And somewhere, a crypto influencer is probably tweeting 'THIS IS FINE' with a laser-eyed meme. The next 72 hours could separate a healthy correction from something uglier.
Bitcoin’s Support Clusters Around $106,000 And $98,000
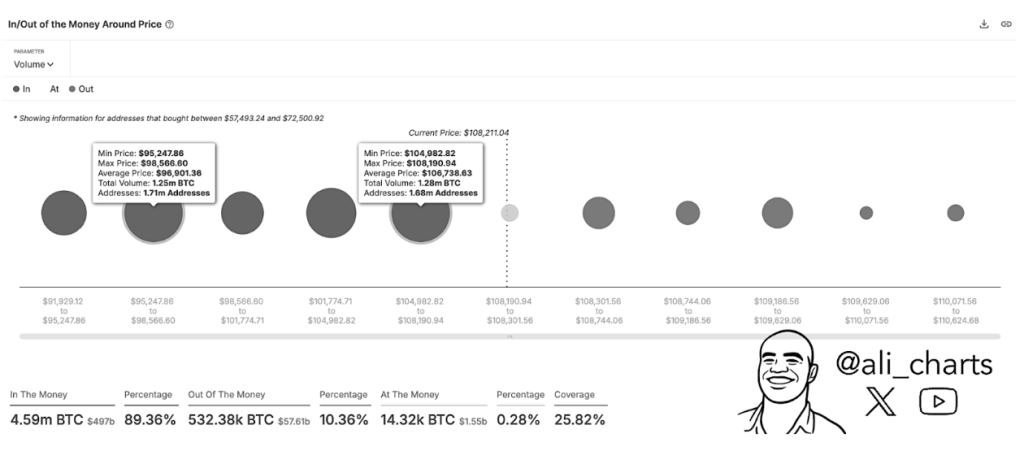
Taking to the social media platform X, crypto analyst Ali Martinez pointed to two major support levels based on data showing Bitcoin’s purchase clusters. This data is based on Sentora’s (previously IntoTheBlock) In/Out of the Money Around Price metric among addresses that bought Bitcoin close to the current price.
As shown by the metric, the most important current zones of purchase are at $106,738 and $98,566. These two zones are where massive buying activity has occurred in the past few weeks, and they could act as support in case of a Bitcoin price crash.
The first zone, between $104,982 and $108,190, contains 1.68 million addresses with a total volume of 1.28 million BTC at an average price of $106,738. Below the first zone, a larger group of 1.71 million addresses holds a greater volume of 1.25 million BTC within the price range of $95,248 to $98,566, with an average price of $98,566.
As long as Bitcoin continues to trade above these levels, the ongoing rally could continue to push upward. However, if these pockets of demand are broken with enough selling pressure, the leading cryptocurrency could enter into an uncertain price zone with little buying interest to provide support.
Speaking of selling pressure, on-chain data shows a slowing sell pressure among large holders. According to data from on-chain analytics platform Sentora, bitcoin recorded its fifth straight week of net outflows from centralized exchanges. The past week alone saw more than $920 million worth of BTC moved into self-custody or institutional products, mostly Spot Bitcoin ETFs.
Bitcoin Needs To Break Weekly Resistance For New Highs
Even with solid demand zones beneath, Bitcoin’s path to new highs is not yet confirmed. Analyst Rekt Capital weighed in with his analysis, noting that Bitcoin is currently facing a strong weekly resistance band just under $109,000. Particularly, Bitcoin is at risk of a lower high structure on the weekly candlestick timeframe chart.
Rekt Capital noted that a weekly close above the red horizontal resistance line must be achieved in order for Bitcoin to reclaim a more bullish stance. That resistance, which is currently around $108,890, is acting as a ceiling for Bitcoin’s upward rally.
As such, Bitcoin WOULD need to make a weekly close above $108,890 to position itself for new all-time highs. Unless there is a convincing break of that level, the price action of Bitcoin could be erratic and susceptible to a retracement to $106,000.
At the time of writing, Bitcoin is trading at $108,160.
Featured image from Unsplash, chart from TradingView
