🚀 SEI Price Primed for Takeoff: W-Pattern & MACD Surge Signal $0.50 Breakout Ahead!

Brace for impact—SEI’s chart is flashing fireworks. A textbook W-pattern and MACD momentum are conspiring to launch this altcoin toward $0.50. Here’s why traders are stacking bids.
### The Technical Setup: A Bullish Perfect Storm
That W-pattern isn’t just doodling—it’s a liquidity magnet. Paired with MACD’s bullish crossover, SEI’s coiled tighter than a VC’s purse strings during a bear market. History says this combo precedes explosive moves.
### The $0.50 Target: More Than Just Hopium?
No crystal balls here—just pure chart gravity. The W-pattern’s measured move points squarely at $0.50. Add in MACD’s upward thrust, and even skeptics are sidelining their 'wen dump' memes. For now.
### The Catch (Because There’s Always One)
Sure, macros could wreck the party—Fed whispers, Bitcoin’s mood swings, or that one exchange CEO tweeting emoji riddles. But today? The stars align. Just don’t bet the farm—unless you’re into 'financial self-discovery.'

The emergence of a W-pattern on the daily chart, along with favorable momentum metrics, has drawn attention from analysts and buyers.
With consistent volume and solid structural support levels, SEI is positioning itself for an extended MOVE to the upside. Market sentiment appears supportive as SEI trades confidently above key moving averages.
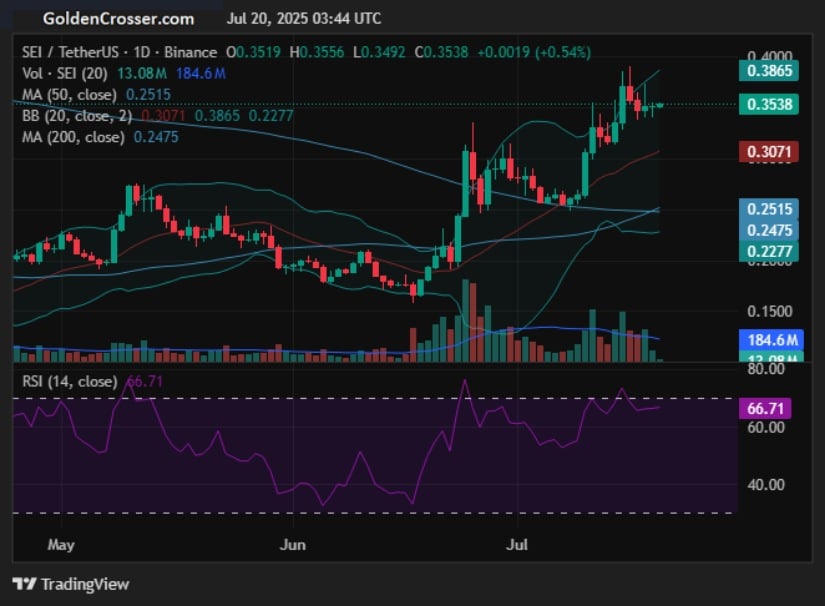
Golden Cross and W-Pattern Confirm Strength on Daily Chart
A key bullish development has been observed on the SEI/USDT daily chart, shared by @goldencrossertw, where the 50-day moving average has crossed above the 200-day moving average. This formation—commonly known as a Golden Cross—serves as a technical signal that long-term momentum has shifted in favor of buyers.
With the 50-day MA at $0.2515 and the 200-day MA at $0.2475, the crossover confirms renewed bullish interest. SEI is currently trading NEAR $0.3538, maintaining a position above both averages, reflecting continued upward pressure.
Source: X
The daily chart also highlights a well-formed W-pattern, suggesting a bullish reversal structure. This technical setup is defined by two low points around $0.28 and a neckline resistance breakout near $0.35, which SEI has already breached.
Volume on the breakout remains healthy, with over 184 million in daily turnover. The pattern’s projected target lies in the $0.45–$0.50 region, assuming the breakout maintains strength. Momentum remains intact with the Relative Strength Index (RSI) at 66.71, leaving room for further upside before entering overbought conditions.
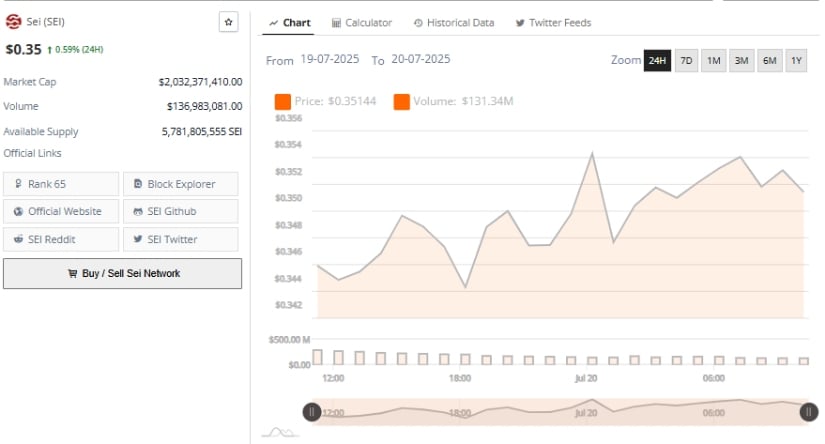
Stable Intraday Support and Continued Buyer Activity
The 24-hour chart shows Sei holding above key support at $0.345, establishing a consistent intraday base. The asset briefly reached highs of $0.356 before settling around $0.35, posting a 0.59% gain on the day. Buyers have successfully defended the $0.345–$0.348 range, with price testing that zone multiple times during the session.
Each retest has been followed by renewed bullish momentum, suggesting accumulation by short-term participants.
Source: BraveNewCoin
Price action shows a staircase formation with higher highs and higher lows throughout the session. Trading volume reached $136.98 million, and the token’s market capitalization remains above $2.03 billion, securing SEI’s spot at Rank 65 in the global crypto rankings.
The circulating supply exceeds 5.78 billion tokens, and the steady price rise without significant volatility points to controlled accumulation. Unless the $0.345 support zone is broken, SEI remains well-positioned to challenge resistance at $0.370, with a breakout likely accelerating the climb toward $0.40.
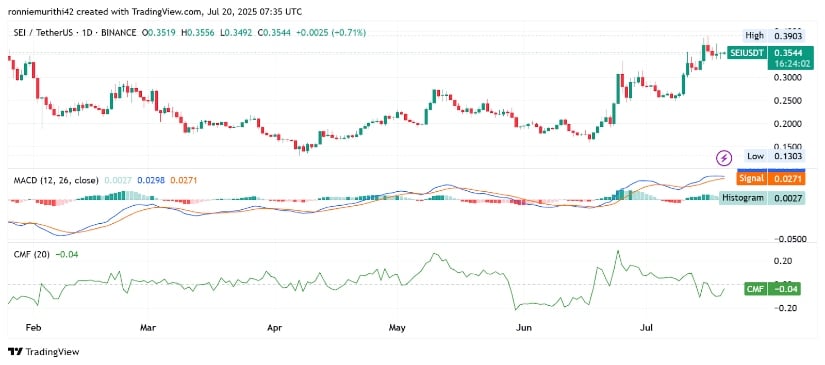
At the Time of Writing: MACD Momentum and CMF Divergence in Focus
At the time of writing, SEI is priced at $0.3533, continuing a rally from its sub-$0.30 lows. The token previously marked a local high at $0.3903, and while it currently consolidates just below that level, the trend remains intact with a series of higher lows.
If the price manages to retest and close above $0.3903, momentum may drive it closer to the projected $0.50 target implied by the W-pattern.
Source: TradingView
The Moving Average Convergence Divergence (MACD) remains in a bullish alignment, with the MACD line at 0.0297 and the signal line at 0.0271. Although the histogram is beginning to flatten, it still shows a positive reading of 0.0027, suggesting upward momentum remains valid.
Meanwhile, the Chaikin Money Flow (CMF) is slightly negative at -0.04, which may indicate a temporary divergence between price action and capital inflows. A CMF recovery above zero WOULD reinforce confidence in continued accumulation, strengthening the bullish case.
