Optimism (OP) Primed for $0.90 Surge as V-Shaped Rebound Defies Crypto Winter

Flying against the bearish tide, Optimism's native token stages a textbook recovery—proving once again that in crypto, dead cats bounce hardest.
V-Shaped or Vaporware? The Anatomy of OP's Rally
Traders are chasing the $0.90 target like it's a bull market, ignoring the irony that 'optimism' currently outperforms most fundamental metrics. The token's parabolic move mirrors the same speculative frenzy that got us into this mess—but hey, those Fibonacci retracements look pretty.
When Lambo? Technicals Suggest Soon(ish)
The charts scream 'buy the dip' while the macroeconomic backdrop whispers 'sell the rip.' Classic crypto cognitive dissonance. Still, that 50-day moving average just got punked harder than a centralized exchange's terms of service.
Memo to degens: This isn't financial advice. But if you're gonna ape in, maybe hedge with some reality checks.

The token recently recovered from a sharp decline and now trades firmly above key support zones. Technical indicators show bullish momentum building as trading volumes rise. Market attention is shifting toward a projected MOVE toward the $0.90–$1.00 range.
Optimism Price V-Shaped Recovery Points to Strong Accumulation
A chart analysis shared by Dr. Alpha (@AlphaVerseHQ) on X shows that Optimism (OP/USDT), currently priced at $0.749, has staged a clear V-shaped recovery from a recent low of $0.458. This rebound structure typically suggests that the market has absorbed previous selling pressure, allowing for a fresh phase of accumulation.
The price has broken above the $0.70–$0.75 zone, a level that previously acted as resistance, and is now turning into support. A pattern of steady green candles and higher lows is establishing a bullish foundation.
![]()
Source: X
The analyst’s chart features a zigzag projection that targets the $0.90–$1.00 range. The previous local high NEAR $0.953 now serves as a critical resistance level, and a breakout above this threshold could open the door to a larger rally.
If volume increases near these resistance points, the market could see a continuation toward higher levels, particularly in line with broader LAYER 2 sector strength. The analyst further links this rally potential to Ethereum’s macro performance, noting that a break of ETH’s all-time high could trigger renewed investor confidence across Ethereum-integrated L2s such as OP.
Market Metrics Support Positive Outlook
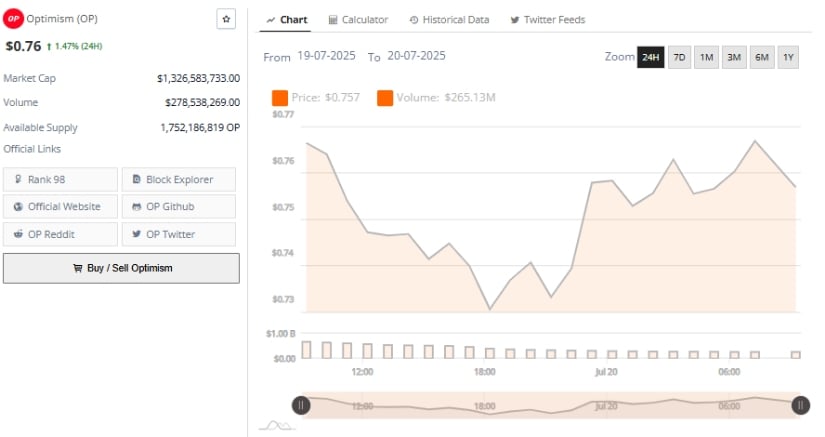
The 24-hour price chart for Optimism indicates a continuation of short-term bullish momentum. At the start of the session, OP was trading around $0.757 before a brief pullback brought it to a low of $0.735. Despite the dip, support levels held firm, and the token rebounded back above $0.75. The price currently stands at $0.76, marking a 1.47% daily increase. This stability signals strong underlying demand and positioning among short-term holders.
Source: BraveNewCoin
The chart displays a staircase-style upward movement, characterized by pullbacks followed by higher rallies. This pattern suggests ongoing accumulation and may indicate preparation for a test of resistance levels around $0.78–$0.80.
With a market capitalization of $1.32 billion and a 24-hour trading volume of $278.5 million, Optimism is maintaining its status as an actively traded mid-cap token. Its current rank of 98 reflects increased attention as Ethereum’s scaling roadmap evolves. If the asset holds above the $0.74 support, buyers may push toward the $0.85 level in the short term.
Technical Indicators Signal Momentum at the Time of Writing
On the daily chart, OP/USDT is trading at $0.774, up 1.44%, with a visible upward trend from late June. The consistent formation of higher highs and higher lows points to sustained buying interest. Candlestick structure confirms a lack of seller dominance, while buyers appear to be in control of momentum as the token nears the $0.80 psychological resistance.
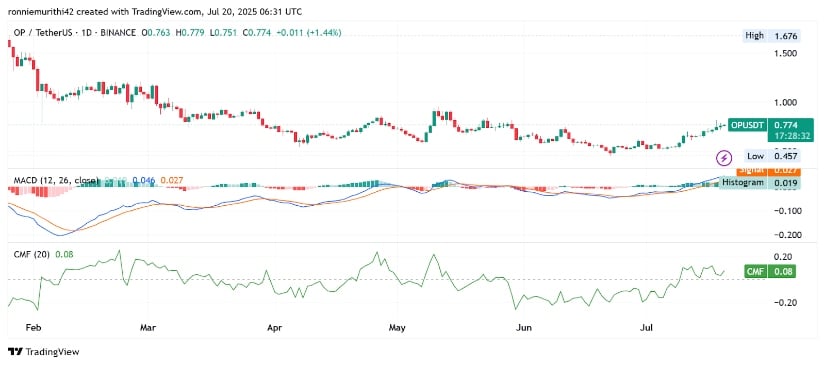
Source: TradingView
Momentum indicators align with this bullish setup. The MACD shows a widening gap between the MACD and signal lines, with histogram bars growing steadily in the positive region. The MACD line currently reads 0.046, while the signal line is at 0.027, supporting upward momentum.
The Chaikin Money FLOW (CMF) remains above zero at 0.08, suggesting capital inflow into OP is strong. Together, these indicators confirm accumulation and sustained interest, with continued movement above $0.735 likely to reinforce bullish momentum toward $0.90.
