Hyperliquid Defies Crypto Slump with $242B Volume Surge in May

While traditional markets obsessed over Fed rate cuts, Hyperliquid quietly ate Wall Street’s lunch—processing a staggering $242 billion in trades last month.
The perpetual swaps platform’s volume spike comes as institutional traders flock to derivatives, proving yet again that crypto’s real action happens in the shadows of regulated markets.
Who needs spot ETFs when you can 100x your existential dread with leverage?
HYPE price technical analysis
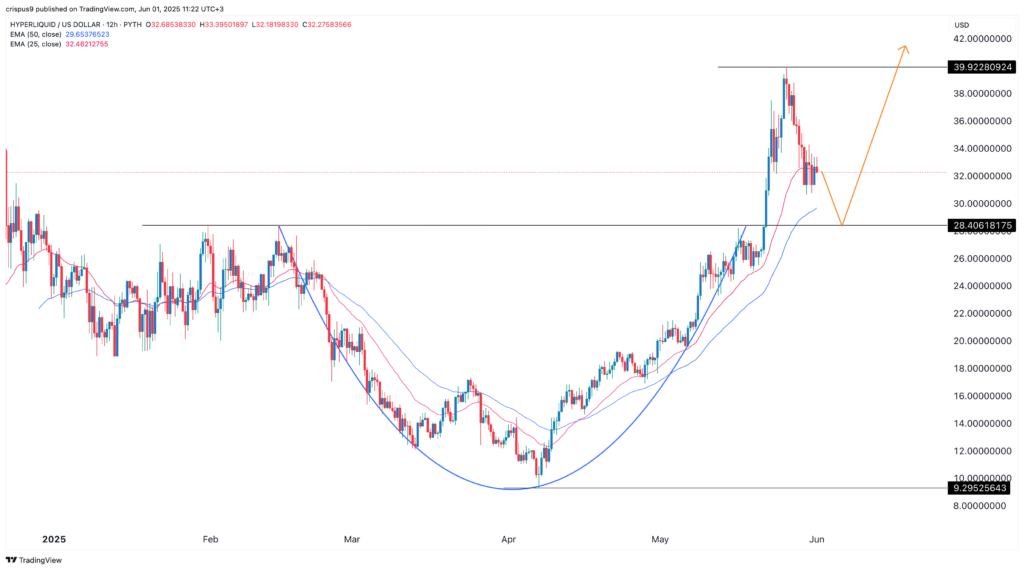
The 12-hour chart shows that the HYPE price bottomed at $9.2952 on April 7, then surged to $39.92 in May. It formed a cup-and-handle pattern whose upper side was at $28.40. A C&H pattern is one of technical analysis’s most bullish continuation patterns.
HYPE has pulled back as the crypto market crashcontinued.
The most likely scenario is it drops and retests the upper side of the cup and then resumes the uptrend. This performance is known as a break-and-retest and is a popular continuation sign.
