Cardano (ADA) Price: Weekly Charts Signal Explosive Rally as Bullish Momentum Accelerates

Cardano's ADA isn't just creeping—it's gearing up for a sprint. The weekly charts have flipped decisively green, and traders are scrambling to position themselves before the next leg up.
Technical breakout or just another crypto hype cycle? The charts don't lie—but your portfolio might.
Here's why ADA's price action has analysts whispering 'altseason':
- Bullish divergence on weekly RSI: First time since the 2023 rally
- Volume profile shows accumulation at key support
- On-chain data reveals whales moving ADA off exchanges
Meanwhile, traditional finance still can't decide whether to FOMO in or dismiss it as 'digital tulips'—their loss when the breakout comes.
One thing's certain: When the crypto markets wake up, they move fast. And right now, ADA's alarm clock is buzzing louder than a Wall Street trading desk at 4 PM on a Friday.
TLDR
- Cardano reclaimed 9th spot by market cap with 16.29% weekly gains, overtaking TRON at $30.4 billion market value
- Technical analysis shows ADA forming ascending triangle pattern just below $0.87 resistance level
- Weekly MACD indicator turned bullish with positive crossover signaling potential trend reversal
- Risk score sits at 43, matching historical accumulation zones that preceded major price rallies
- Fibonacci levels at $0.846 and $1.14 provide clear roadmap for next price movements
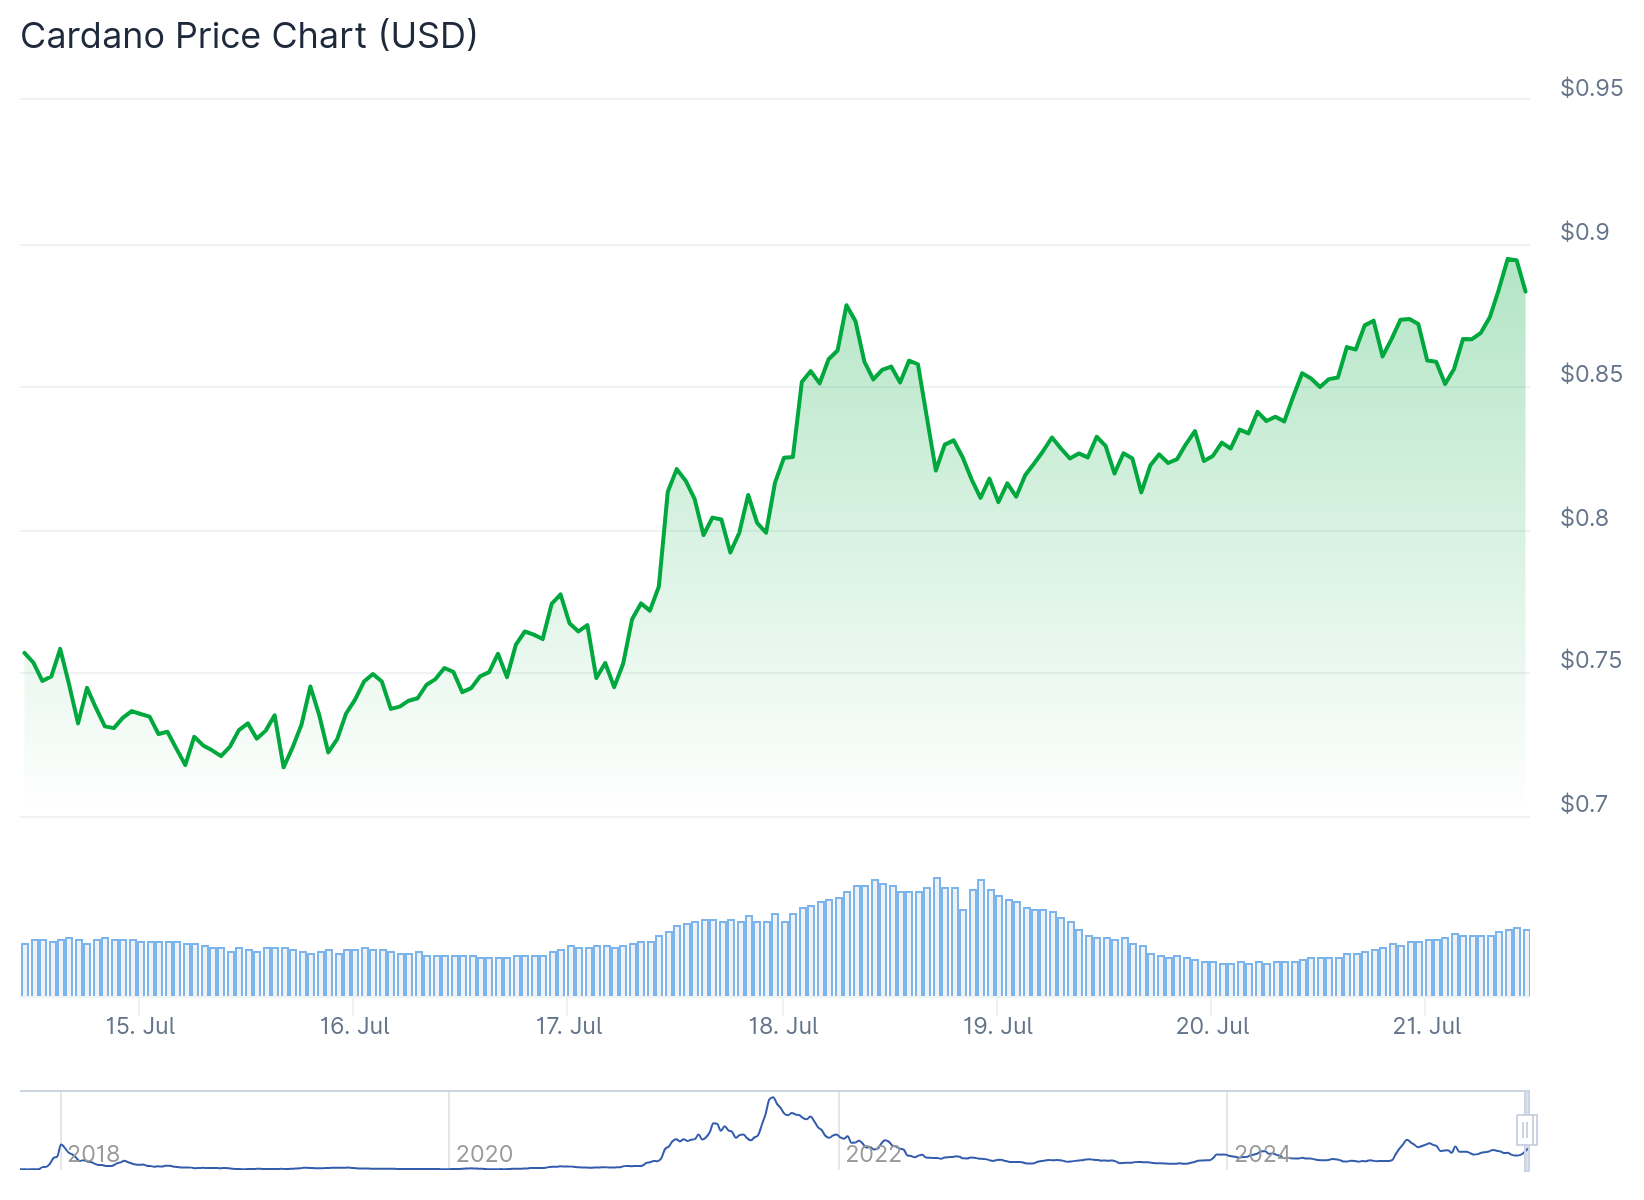
Cardano price has surged back into the cryptocurrency spotlight with strong weekly performance. The digital asset gained 16.29% over seven days to reclaim the 9th position by market capitalization.
ADA now holds a $30.4 billion market cap after overtaking TRON in the rankings. TRON managed only 4.69% weekly gains in comparison. This shift suggests capital rotation is favoring projects with stronger recovery potential.
The price currently trades at $0.87 with clear technical strength emerging. ADA has broken above all major moving averages including the 200-day EMA at $0.6939. The 20-day EMA climbed to $0.7192 and continues rising above the 50-day and 100-day averages.
Technical indicators show mixed but generally positive signals. The RSI reads 81.99, placing the market in overbought territory. However, the favorable RSI angle suggests buyers remain in control despite the elevated reading.
MACD values provide additional support for the bullish case. The MACD line sits at 0.02270 above the signal line at 0.03691. The expanding gap and increasing histogram demonstrate accumulating bullish pressure with no reversal signs yet visible.
The Percentage Price Oscillator shows similar strength. The PPO line reads 8.50 ahead of the 5.41 signal line. This widening gap typically indicates building momentum without current weakness indicators.
Chart Patterns Signal Breakout Potential
Short-term price action reveals an ascending triangle formation below key resistance. ADA consolidates between $0.85 and $0.87 with higher lows pressing against flat resistance. Volume contraction during this consolidation suggests the market may be preparing for expansion.
A clean breakout above $0.87 WOULD put the $1.00 level firmly in play. Minor resistance exists around $0.93 before reaching the psychological barrier at one dollar.
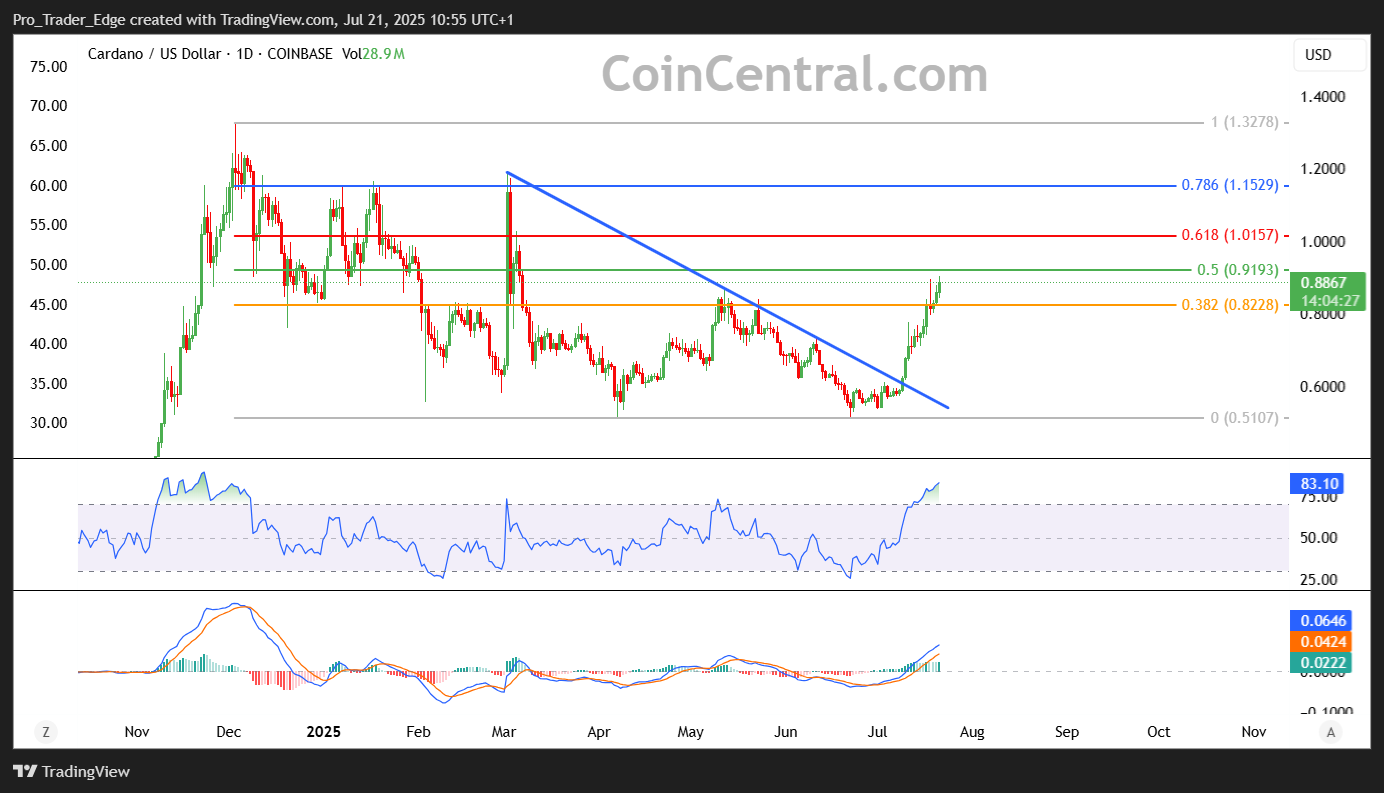
Weekly chart analysis shows a breakout from a multi-month falling wedge pattern. The resistance trendline that capped price since 2024 highs has been breached. ADA reclaimed both the wedge structure and horizontal support NEAR $0.80.
Risk Metrics Support Accumulation Theory
Cardano’s current risk score of 43 matches levels historically associated with early accumulation phases. The last time risk reached similar levels under comparable conditions, ADA traded around $0.10. The current price near $0.80 creates a substantial delta for risk-adjusted opportunity assessment.
Last time Cardano risk was at this level (43) at the confluence of a similar business cycle, $ADA was .10
Now its .80
The upside is insane.
And many are underestimating this.
Just like last cycle. pic.twitter.com/pg8ESaWc6M
— Dan Gambardello (@cryptorecruitr) July 18, 2025
This mid-range risk zone suggests the market hasn’t overheated despite recent gains. The confluence between cycle timing and sentiment reset supports the possibility of further upside movement.
Fibonacci analysis provides clear price targets ahead. The 0.5 Fibonacci level near $0.846 is being retested successfully. The next target sits at the 0.618 Fib level around $1.14, which acted as fierce resistance during previous rallies from November to January.
Weekly momentum indicators are turning positive after extended weakness. The MACD histogram flipped green for the first time in days with a bullish crossover developing. The signal line curves upward through the MACD line, typically a reliable trend reversal sign on higher timeframes.
If current momentum holds, the $1.80 region represents a reasonable medium-term target based on major horizontal levels. Bulls have protected every dip so far, with pullbacks toward $0.78-$0.80 likely to attract new buyers.
