Litecoin Primed for Explosive Rally: Bullish Indicators Target $200+ in 2025

Silver to Bitcoin's gold just flashed its most aggressive buy signal since 2021.
Technical breakout underway
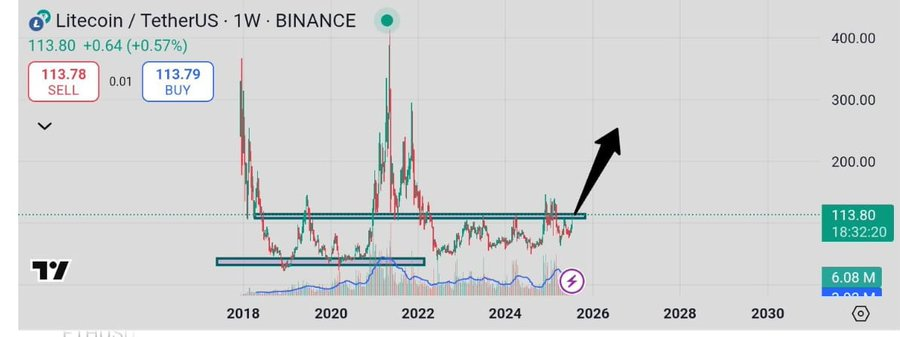
The LTC chart paints a textbook bullish pattern—descending wedge breakout on weekly timeframe, RSI curling up from oversold territory. Last time this happened? A 300% pump in 90 days.
Fundamentals aligning
MimbleWimble privacy upgrades finally operational, exchange reserves hitting 4-year lows (supply squeeze, anyone?), and merchant adoption up 17% YoY per Litecoin Foundation data.
Wall Street's favorite crypto analyst—who totally didn't miss the last three bear markets—says $200 is "conservative" if Bitcoin holds $60k. Meanwhile, TradFi institutions are still trying to custody NFTs in their 1999-era settlement systems.
This isn't financial advice. But ignoring the most battle-tested altcoin at these levels? That's just leaving money on the table.
- Litecoin jumps 4.7% to $117 with a 75% surge in daily trading volume, retests key resistance zone.
- RSI at 66.54 and MACD above zero suggest a bullish trend with room for further upward movement.
- Analysts eye a breakout toward $200–$500 if LTC closes above $117 with strong volume.
As of press time, Litecoin (LTC) is trading at $117, a 4.7% increase over the past 24 hours. The amount of trading has risen to $2 billion, an amount that marks a 75.37% increase after the next day. Litecoin has experienced a gain of 21.84 percent over the last week. The coin is currently retesting an important resistance area, which may trigger a significant price breakout.
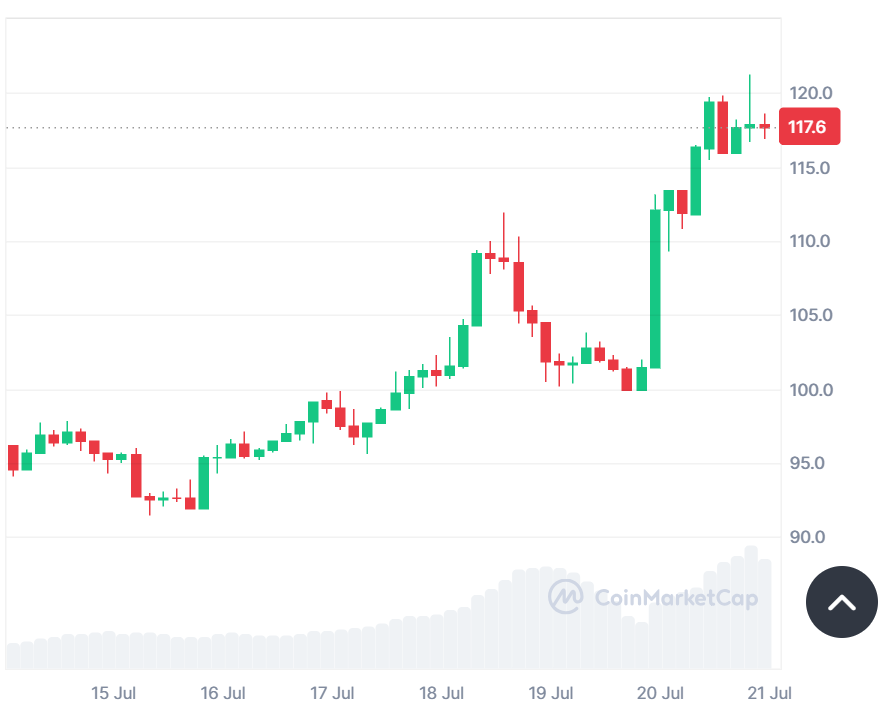
Source: CoinMarketCap
Analyst crypto Patel highlighted that Litecoin started trending at $55. His initial position is already increased by 140% and a second entry at $70 has an 85% gain. He perceives a significant resistance in Figure $117. A bullish close above it may propel the price to the $300 and $500 levels in this bull run cycle.
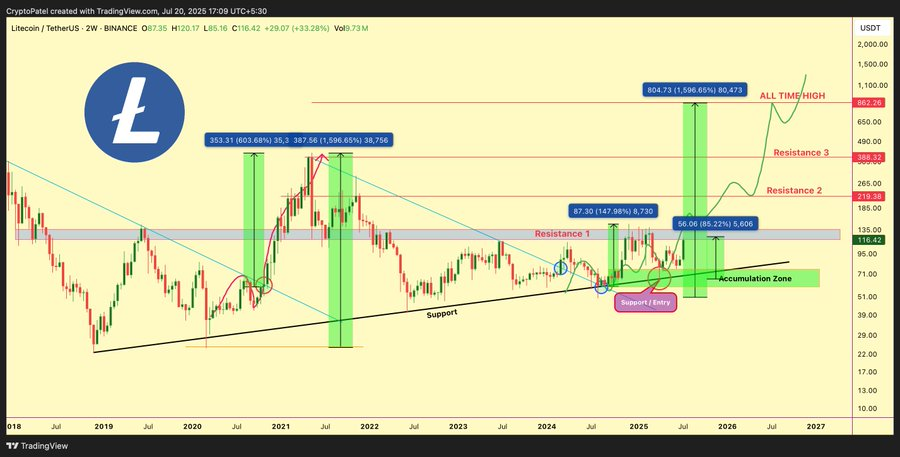
Source: X
Bullish RSI Signal
The Relative Strength Index is 66.54 in the hourly chart. This shows good bullish momentum but not into the overbought area. It makes traders feel better that the rally may go further before any correction is established.
The MACD data also shows a positive tendency. The MACD line is 2.53, which is close to the signal line of 2.89. Although the histogram shows a slight bearish divergence in red bars, the two lines are still above the zero line. This implies sustainable positivity of trend, even in short-term consolidation.
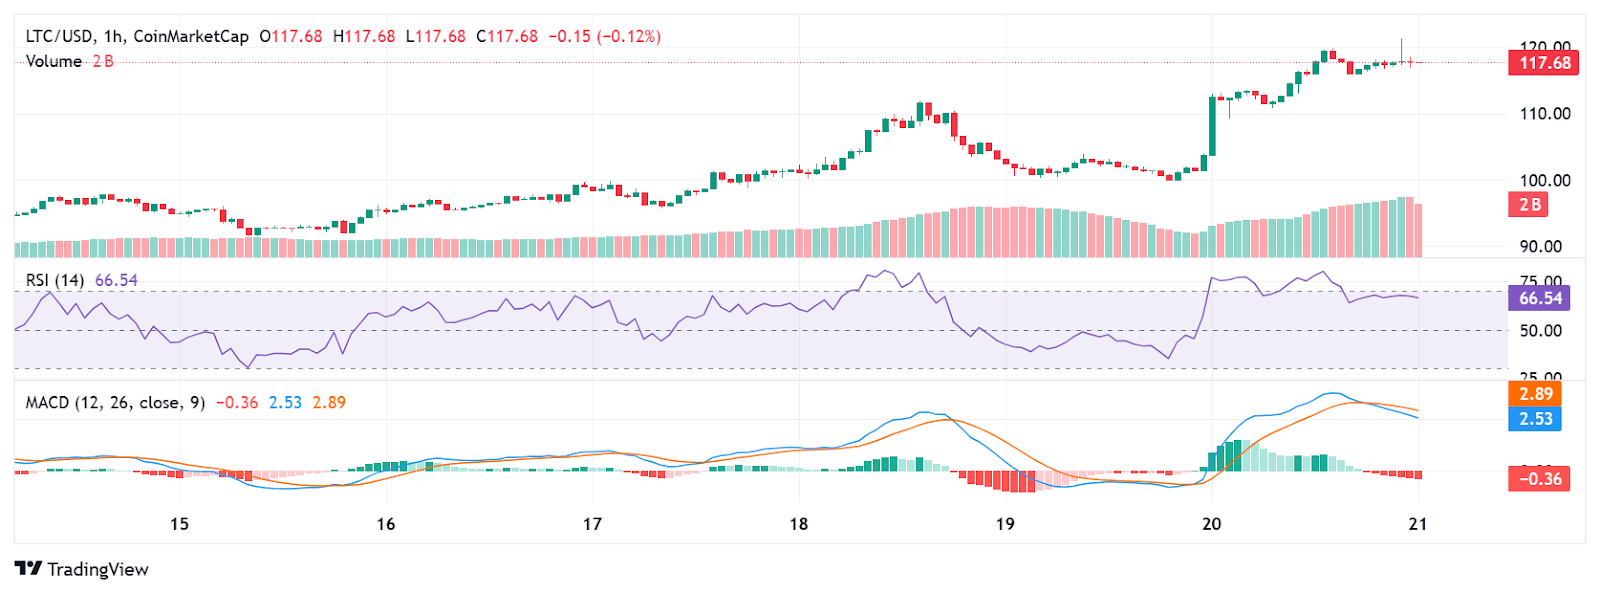
Source: TradingView
Litecoin Eyes $200 Target
Crypto Catalysts revealed that Litecoin is very strong and may reach the target of $200 should the ongoing resistance be breached. The competitive position in the market is good. The following resistance will be around the price at $135-$140. Important support levels exist around the price of $105 and $95 that were strong points of previous pullbacks.
Source: X
CoinGlass data shows that trading volume increased by 82.73% in the last 24 hours to reach $4.05 billion. The open interest increased by 11.25% to $1.12 billion. The open interest-weighted funding rate has moved to 0.0278%, which implies that there are robust long positions and progressive leverage within futures markets.
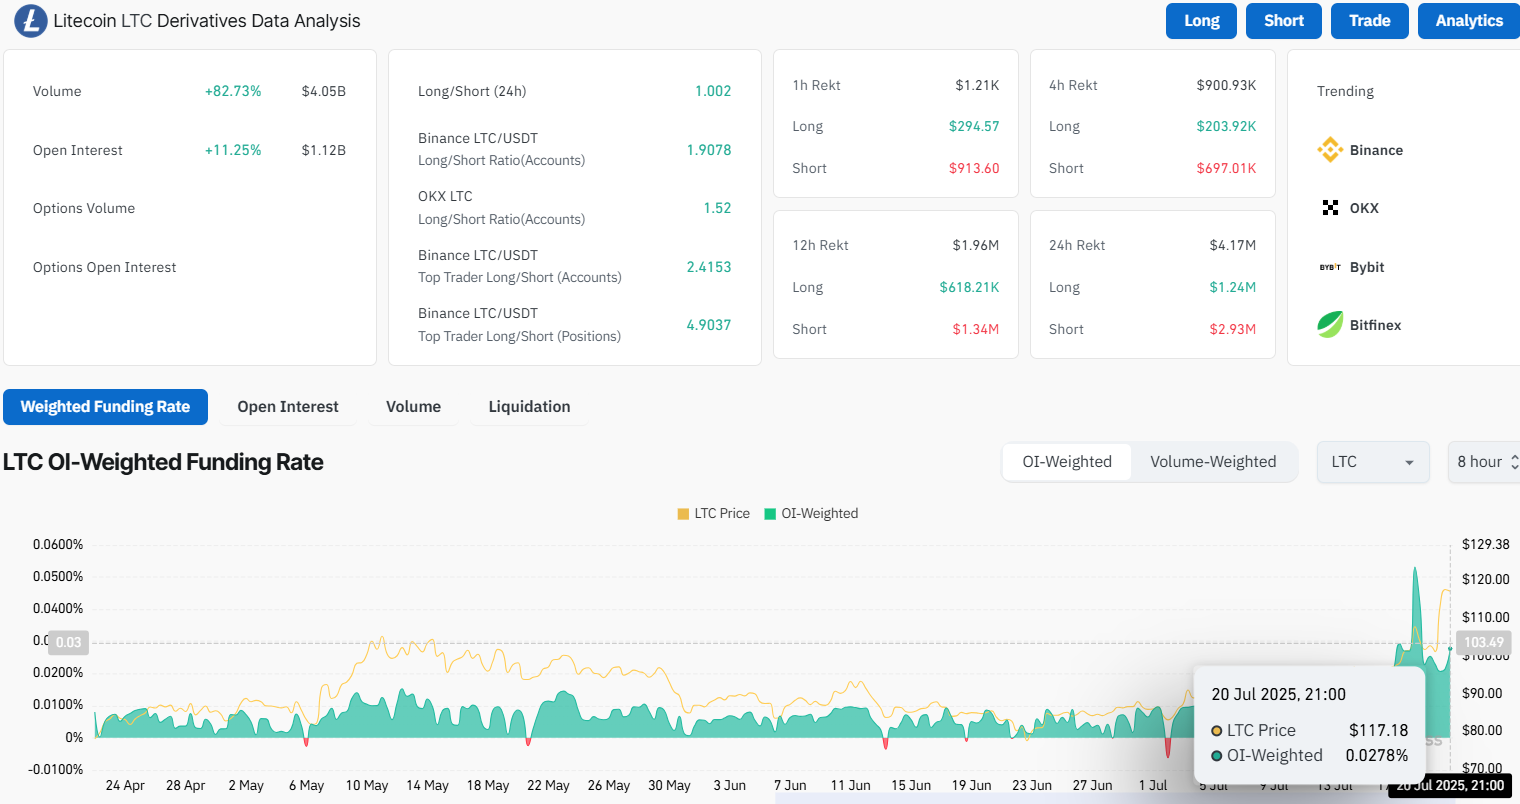
Source: CoinGlass
Technical indicators and on-chain measures back the price action of Litecoin. The coordination of volume, funds, RSI and MACD suggests that a bullish trend will prevail. The next leg up could be validated by a successful break above $117 in high volume. Traders are closely watching the next move.
