XLM Surges Toward $0.50 Milestone as Open Interest Spikes 5.86% – Bulls in Control?

Stellar (XLM) is making waves as it charges toward the psychological $0.50 barrier—fueled by a 5.86% surge in open interest. Traders are piling in, but will this rally have legs or just another crypto pump destined for a 'correction' (read: rug pull)?
Open interest doesn't lie. That near-6% jump signals fresh money flooding into XLM derivatives—usually a precursor to volatility. The $0.50 level now acts as both magnet and resistance; break it, and the FOMO could get ridiculous.
Of course, seasoned degens know the drill: what derivatives giveth, they often taketh away with extreme prejudice. Watch those liquidation levels like a hawk—unless you enjoy donating to the crypto casino.

- XLM aims for $0.50 as open interest rises, but volume drops.
- RSI hits 76.10; MACD shows the strongest bullish crossover since early 2025.
- $0.463 remains key support, with $0.505-$0.55 as targets following bullish continuation.
XLM is currently at a price of $0.4738 after achieving a peak value of $0.4774 earlier today. This rally comes amidst an increase of 5.86% to 514.14 million in open interest. In contrast, the derivatives volume declined by 22.30%, and it’s currently $974.13 million.
This difference between the indicators indicates that traders are cautious. Still, Leveraged positions have increased even though volume has moved in the opposite direction.
XLM Rally Despite $974 Million Drop in Volume
Technically, XLM has experienced a break above important levels of Fibonacci in the daily chart from TradingView. The coin has recaptured the 3.618 Fib zone of $0.463. Also, the latest top may be at the 4.236 level of $0.505. This is a sign of a positive push. The former resistance levels of $0.394 that corresponded to the 2.618 Fibonacci level has become the new support level.
The XLM also closed above the VWAP session at $0.4696. This implies that there is strong demand and the concentration of volumes at its current price. The price structure is bullish as the VWAP acts as the support price level. Buyers continue to be in control while the token trades above the Fibonacci and volume prices.
In structural terms, volume backs an imminent breakout. The XLM volume is currently 69.14 million, worth $974.13 million. In the chart, it can be seen that buyers came in after the price surpassed the $0.40 mark. The rally since that time has not slowed down much.
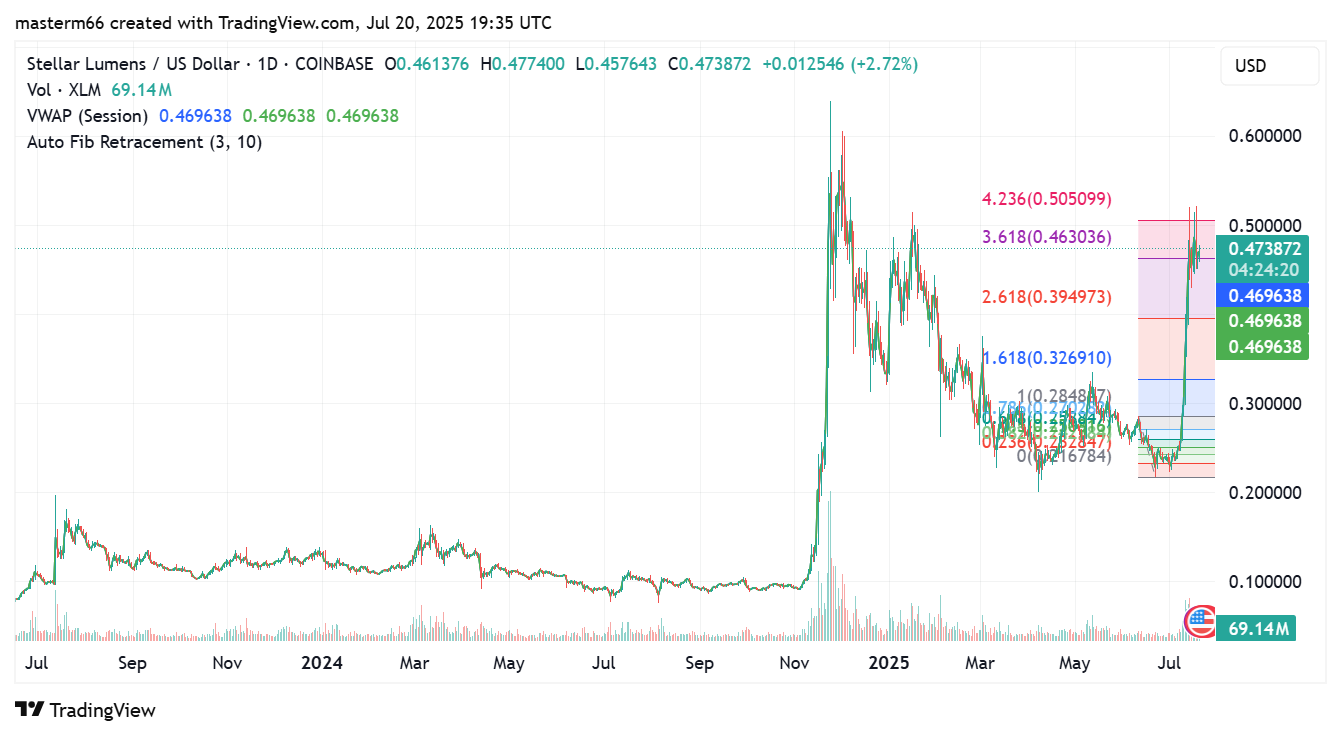
Fib. and VWAP. Source: TradingView
XLM Dips into Overbought Levels
The MACD validates the upward momentum. MACD line stands at 0.0598, which is evidently above the signal line, which has a value of 0.0467. The histogram is also positive, confirming strong bull strength. It is the earliest instance of such a crossover since the beginning of 2025.
The RSI has currently risen above 75, and this shows that XLM is overbought. It is at 76.10, marginally higher than the overbought mark at 70. This implies dominance among buyers, even though there’s still a risk of short-term exhaustion. Nevertheless, readings above 70 RSI are usually common in very heavy breakout periods, but they do not necessarily cause reversals.
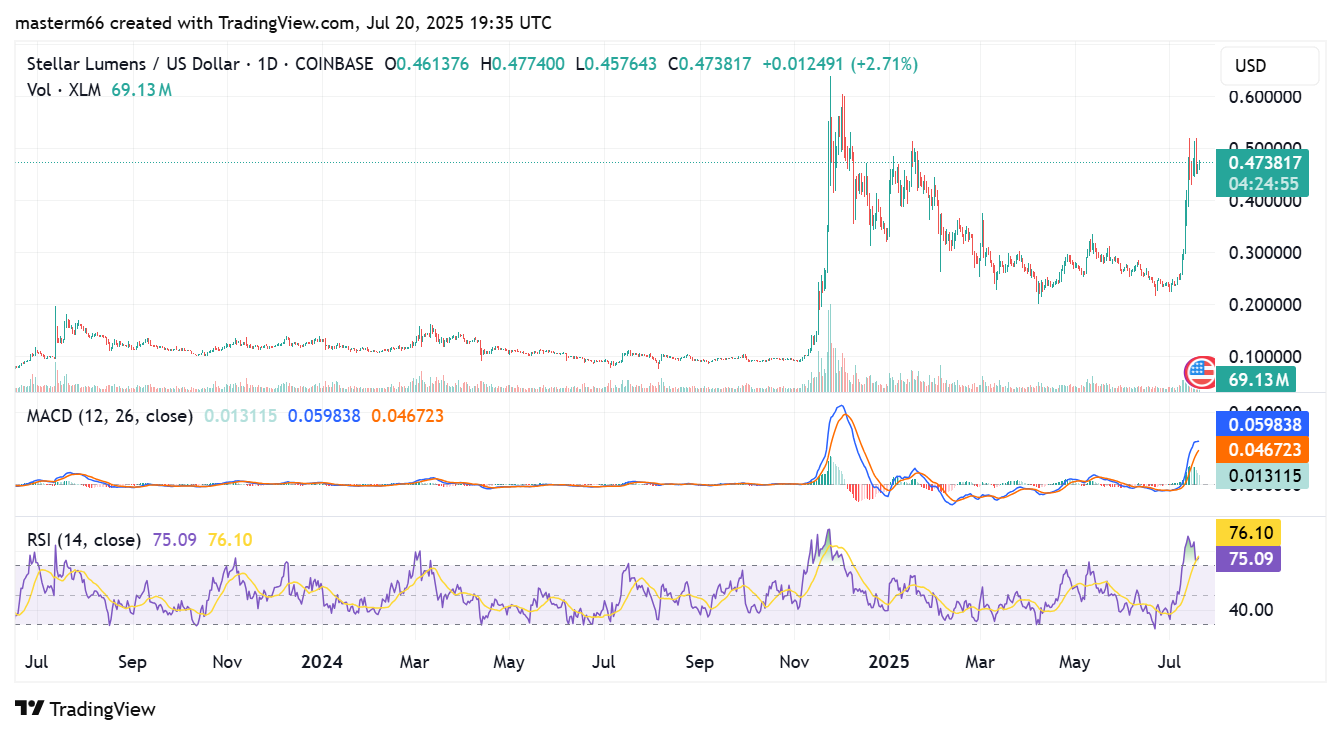
MACD and RSI. Source: TradingView
Open Interest and Volume Divergence
Although the technical momentum is strong, the derivatives indicators suggest cautiousness, according to data from Coinglass. A fall in volume by 22% means there will be less profit taking among short-term players. Yet, the rise in open interest points to growing confidence among those still in position. This kind of divergence can lead to volatile short-term moves.
If XLM holds above $0.463, the next target will be the 4.236 Fib at $0.505. If price breaks above that zone, XLM could attempt a MOVE toward $0.55, depending on market liquidity and sentiment. However, failure to hold the $0.463 level may lead to a pullback toward $0.40 or the VWAP zone.
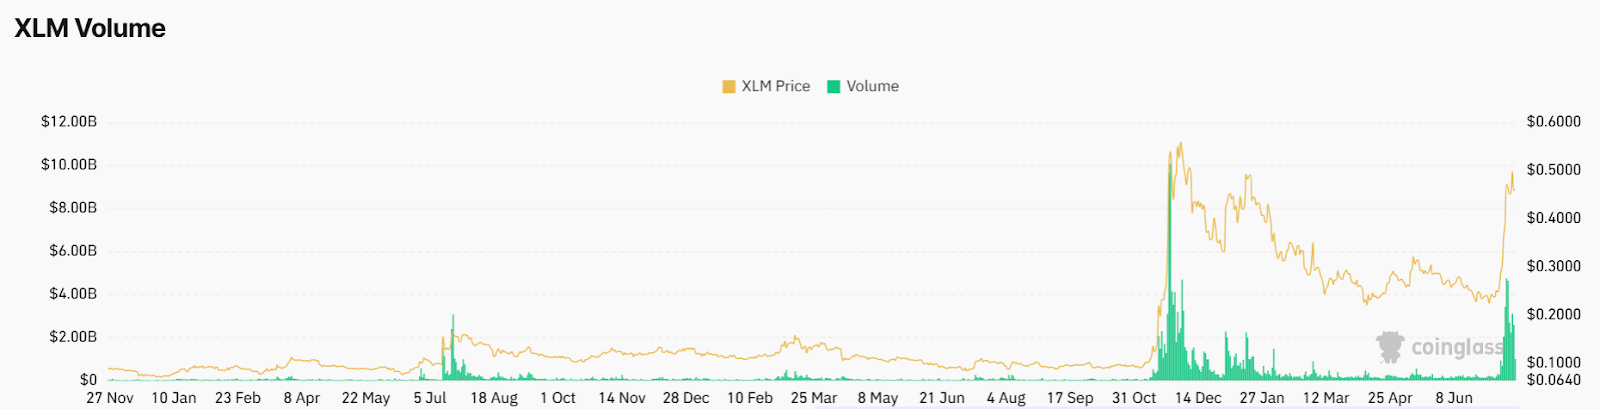
Source: Coinglass
Current market structure supports a bullish continuation, but traders are to watch out for confirmation. If derivatives activity resumes with increasing volume, a breakout above $0.50 becomes likely. Until then, the mixed signals between spot price strength and falling derivatives activity suggest short-term uncertainty.
