BNB Smashes Records: Weekly Close Hits All-Time High as Rally Eyes New Peaks

BNB isn’t just climbing—it’s rewriting the playbook. The crypto asset just locked in its highest weekly close ever, leaving traders scrambling to adjust their price targets.
The breakout no one saw coming
While traditional markets obsess over Fed whispers, BNB’s chart paints a clearer picture: demand is swallowing every sell order. The token’s consolidation phase now looks like a coiled spring.
Liquidity hunters circle
Exchange wallets show whales accumulating on dips—smart money betting the rally has legs. Retail FOMO? Probably brewing as we speak. (Cue the ‘this time it’s different’ chorus.)
The cynical take
Wall Street still can’t decide if crypto is dead or the next big thing. Meanwhile, BNB’s price action screams ‘figure it out later.’ ATH or bust.
Binance Coin’s Open Interest hits a yearly high of $1.05 billion
CoinGlass’ data shows that the futures’ OI in BNB at exchanges rises to a new yearly high of $1.05 billion on Monday from $829.50 million on Wednesday. An increasing OI represents new or additional money entering the market and new buying, which could fuel the current BNB price rally.
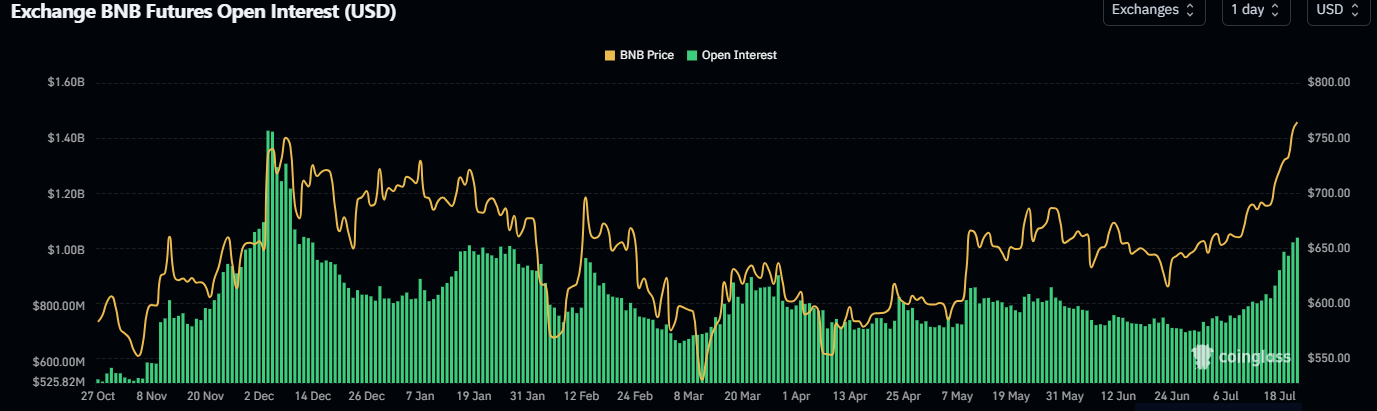
BNB Open Interest chart. Source: CoinGlass
BNB Price Forecast: BNB heads toward its all-time highs
BNB price on the weekly chart has rallied by more than 9% and closed at its highest weekly level to date at $756.82. At the start of this week, on Monday, it continues to trade higher above $760.
If BNB continues its upward trend, it could extend the rally toward its all-time high at $793.86. A successful close above this level could extend the gains toward its 141.40% Fibonacci extension level at $956.92, drawn from the August low of $400 to the all-time high in December at $793.86.
The Relative Strength Index (RSI) on the weekly chart reads 66, surpassing its neutral level of 50, which indicates strong bullish momentum. The Moving Average Convergence Divergence (MACD) indicator on a weekly chart showed a bullish crossover in mid-May. The rising green histogram bars above its neutral zero line suggest that bullish momentum is gaining traction.
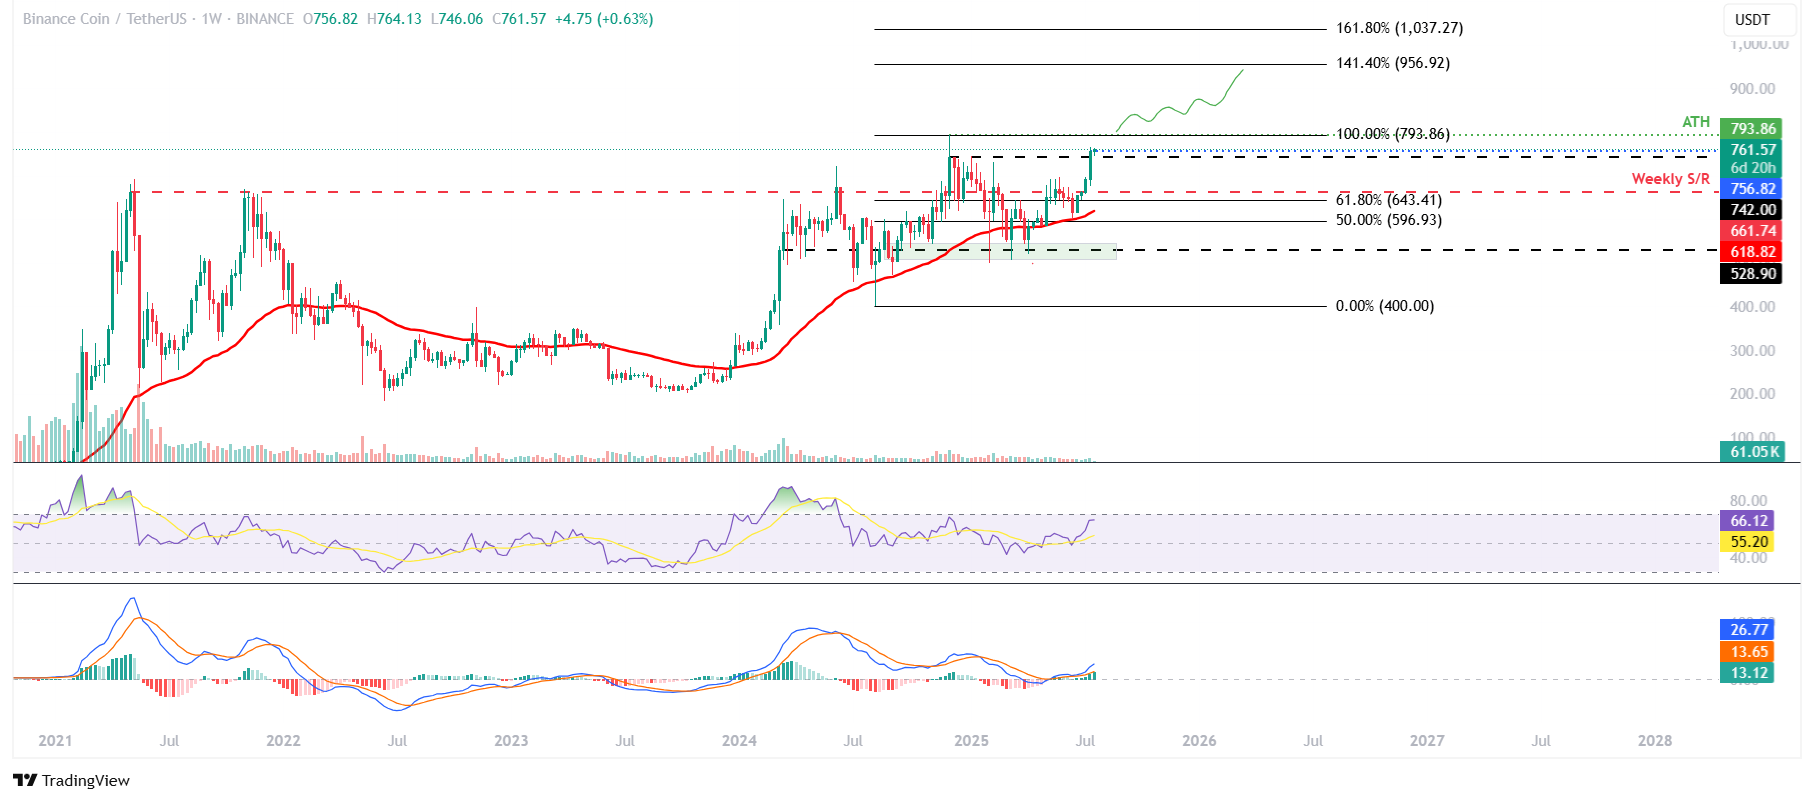
BNB/USDT weekly chart
On the daily chart, BNB broke above the upper trendline of a falling wedge pattern and reached its target at $709.29 on Wednesday. It continued the upward trend, closing above the next weekly resistance at $742 on Sunday. At the time of writing on Monday, it trades at a price higher than $760.
If the weekly level at $742 holds as support, BNB could extend the rally toward its December 4 all-time high of $793.86.
The RSI on the daily chart reads 83, indicating an extreme overbought condition, which traders should be cautious of. The MACD indicator on the daily chart displayed a bullish crossover in early July that still holds. The rising green histogram bars above its neutral zero line suggest that bullish momentum is gaining traction.
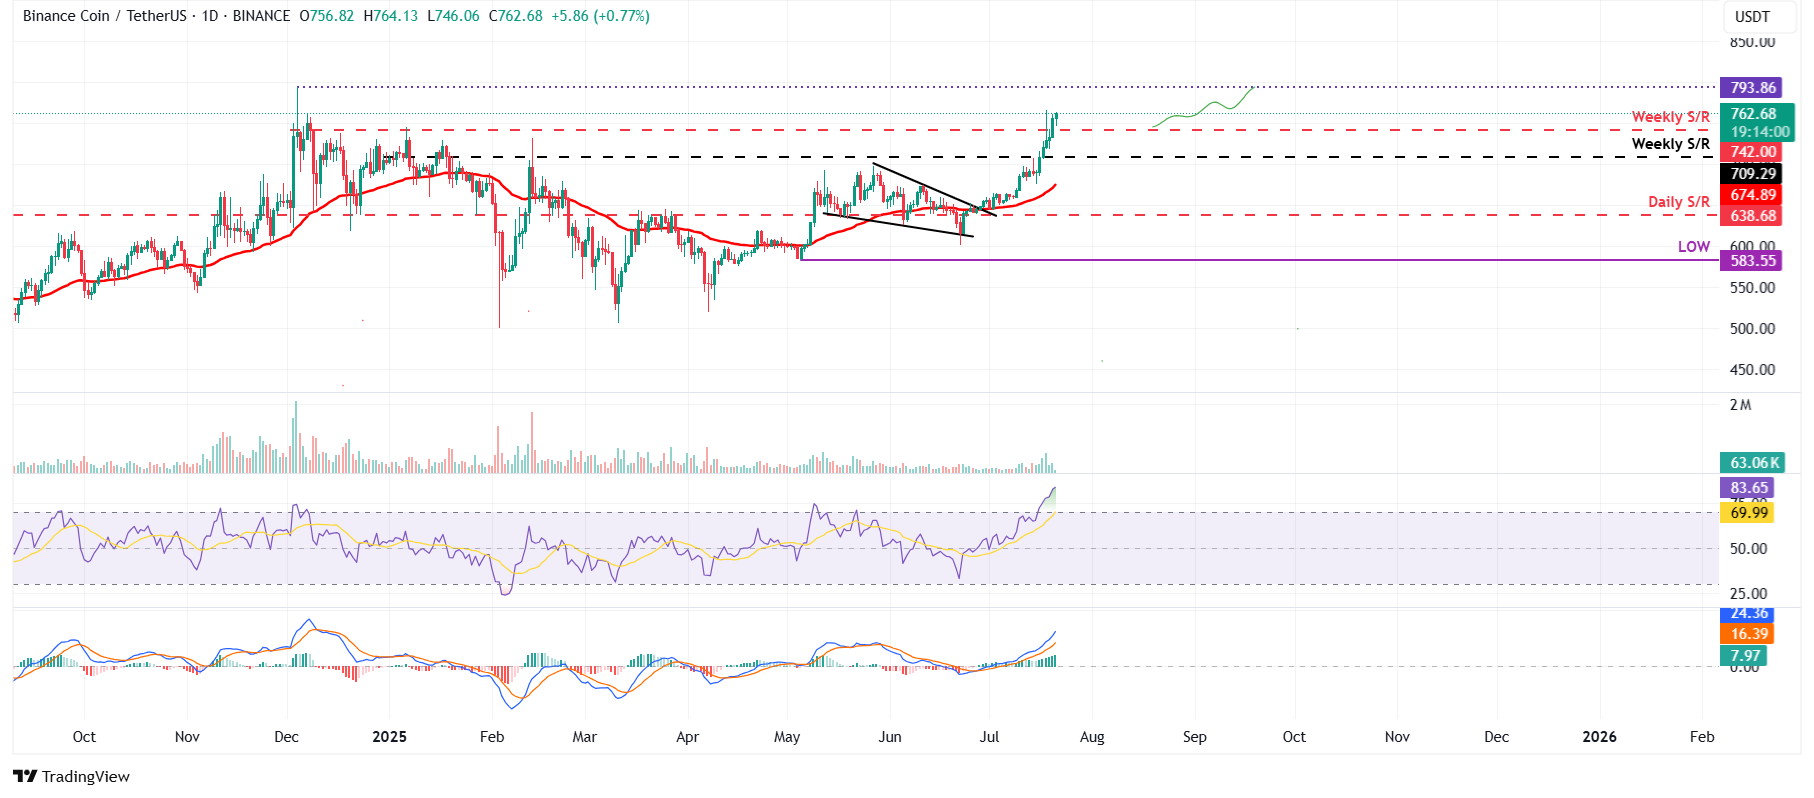
BNB/USDT daily chart
However, if BNB faces a correction, it could extend the decline toward its weekly support at $709.29.
