BTCC
/
BTCC Square
/
Thecryptobasic
/
Solana Eyes $262 as Traders Spot Bullish Cup and Handle Formation—Time to Ride the Wave?
Solana Eyes $262 as Traders Spot Bullish Cup and Handle Formation—Time to Ride the Wave?

19
1
Solana’s chart flashes a classic cup and handle pattern—the same setup that’s preceded monster rallies in everything from Bitcoin to meme stocks. Analysts now peg SOL’s next target at $262, a 30% climb from current levels.
Technical traders are piling in, betting history will repeat. But let’s be real—if Wall Street pulled this kind of tea-leaf reading, they’d charge you 2-and-20 for the privilege.
The real test? Whether SOL can punch through resistance without another network outage stealing the spotlight. Place your bets—the crypto casino is open 24/7.
 Solana Price Chart
Solana has made a U-shaped recovery following a 60% drop from $262 to $105 between January 18 and April 8. With a 64% gain over the past 34 days, SOL now challenges the 50% Fibonacci retracement level at $183 — the midpoint of the previous decline.
This 50% level also acts as the neckline of the rounding bottom pattern on the daily chart. A breakout above this level could push SOL toward the 100% Fibonacci level at $262, a projected 52% increase.
The RSI has begun to rise after dipping below the 14-day SMA from overbought territory, supporting the bullish outlook. Meanwhile, the 50-day and 100-day EMAs are on the verge of a bullish crossover, which may serve as a buy signal.
On the downside, a breakdown below the 200-day EMA would invalidate the reversal pattern, potentially triggering a decline to the $150 level.
Analyst Predicts Parabolic Rise Above $200
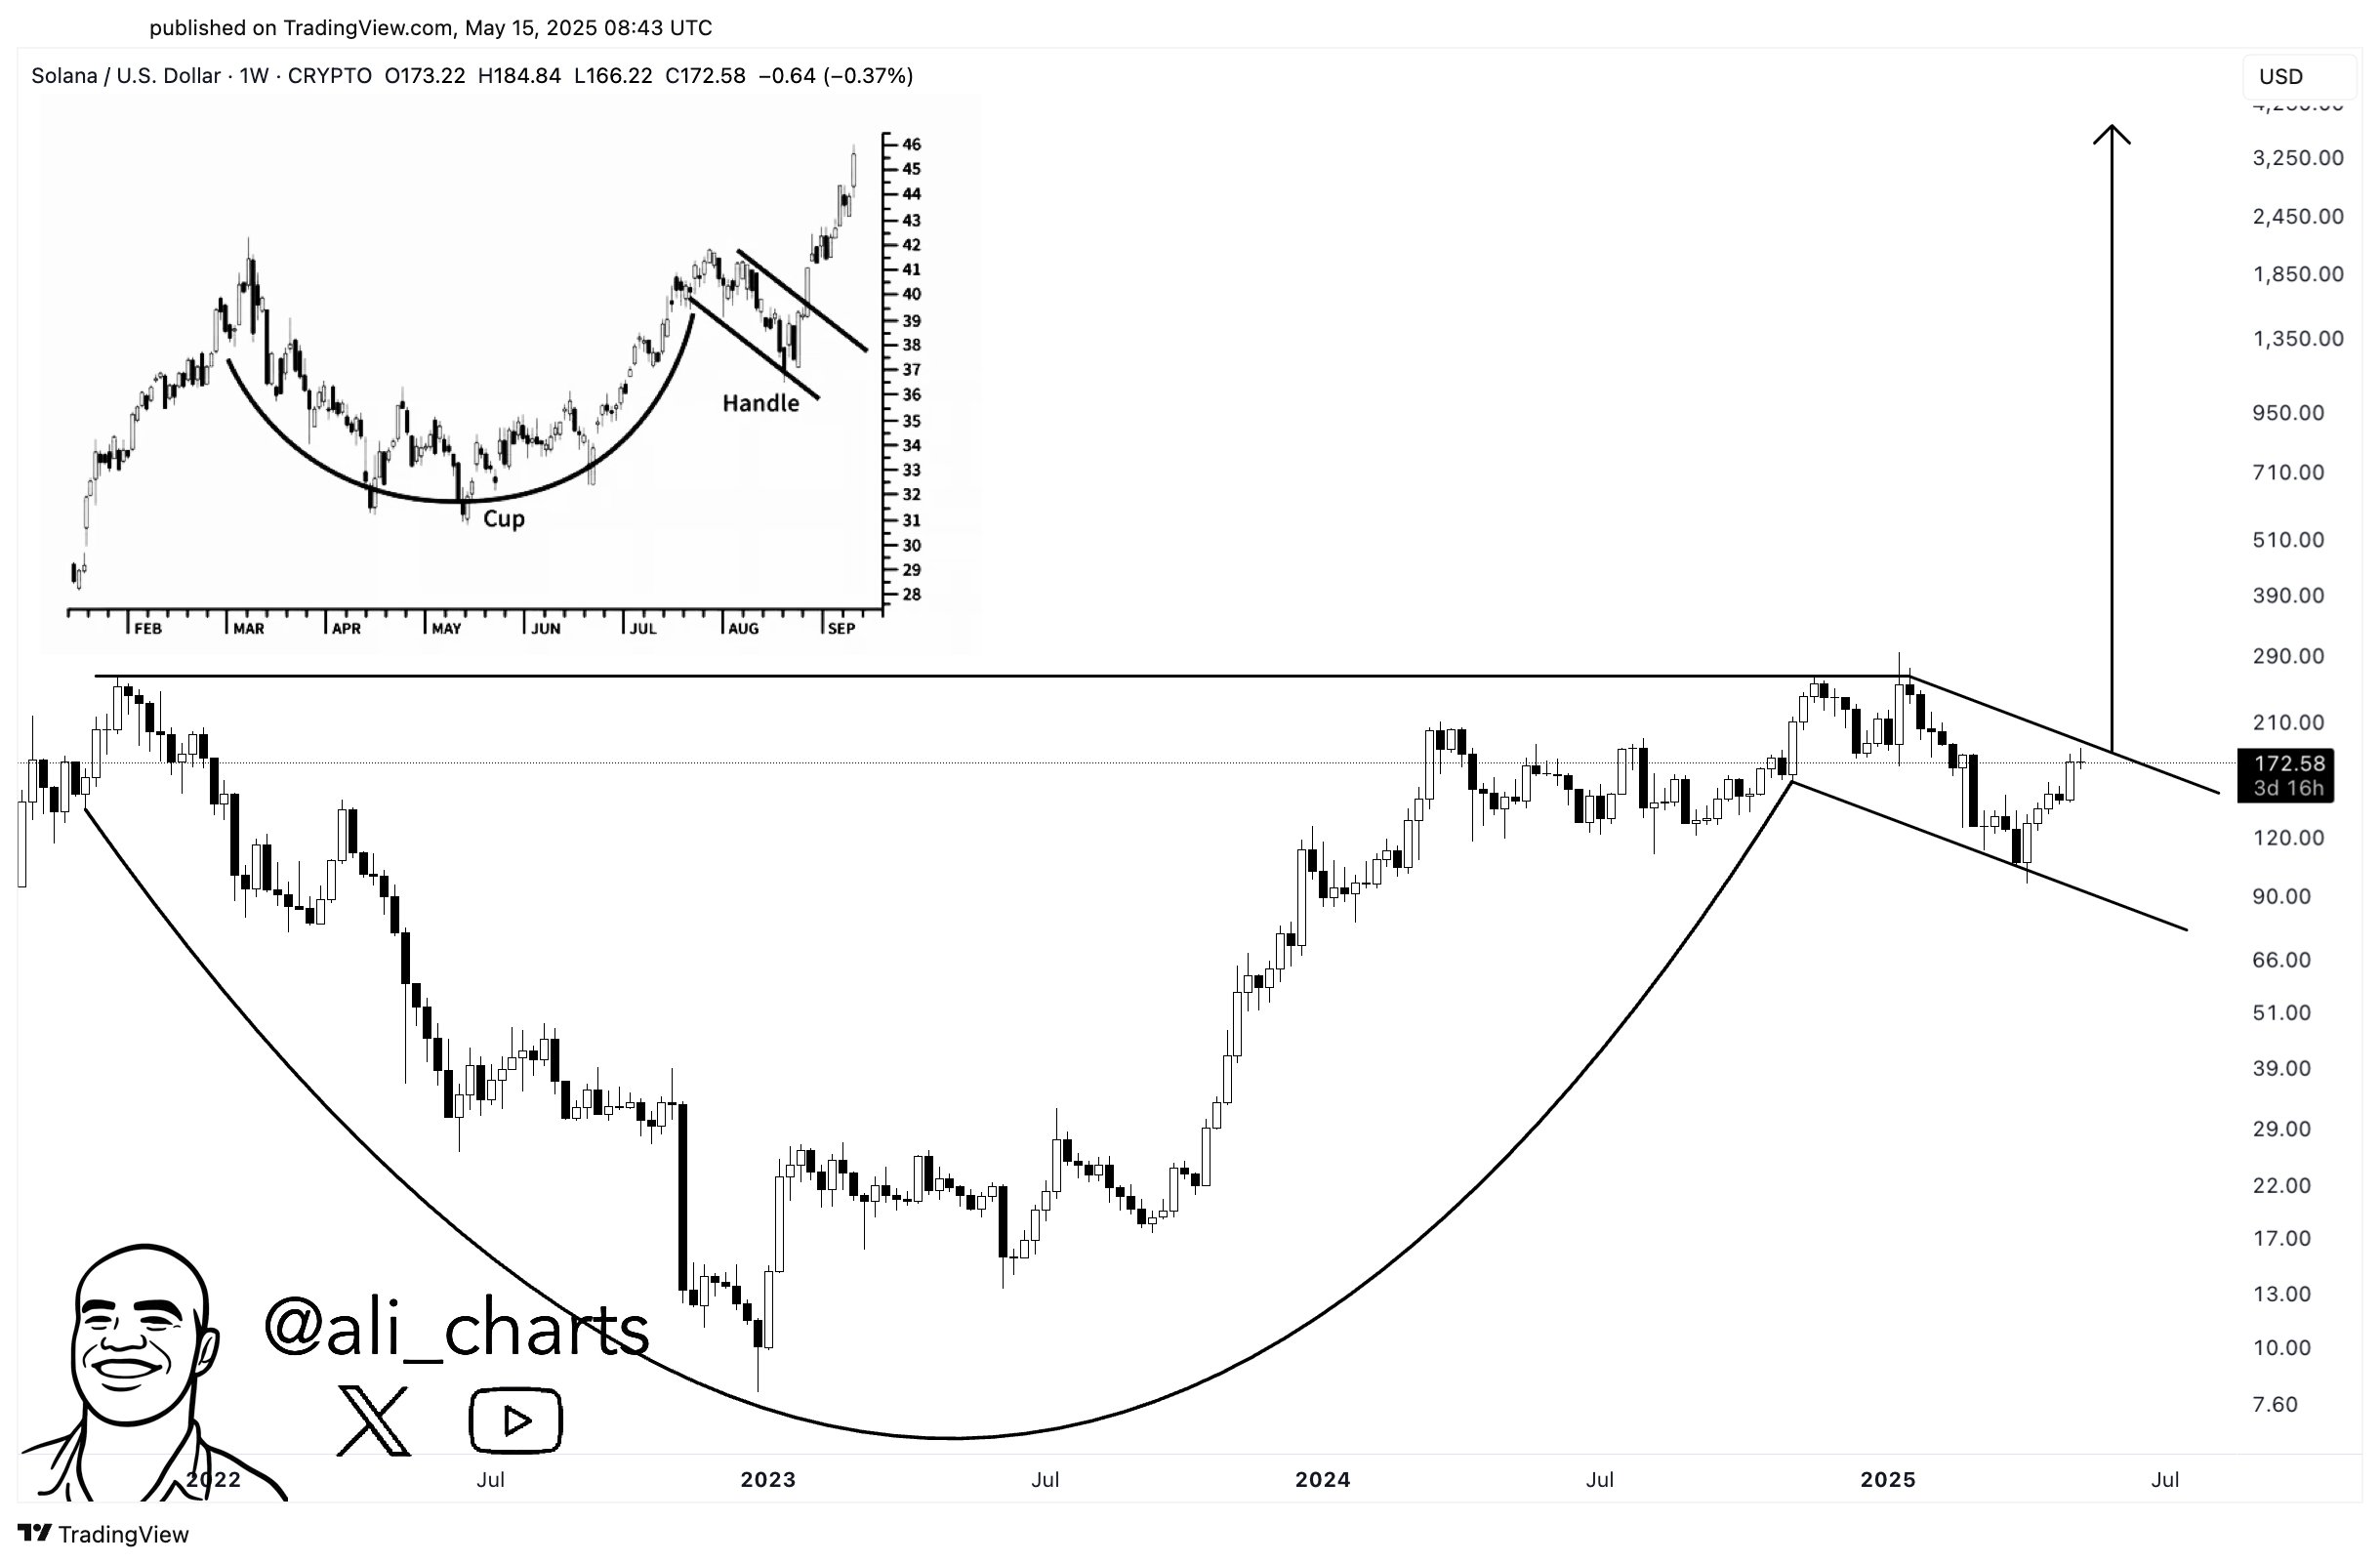
Echoing this bullish sentiment, crypto analyst Ali Martinez recently identified a cup and handle pattern in Solana’s weekly chart. According to Martinez, the handle is forming as a short-term descending channel, with resistance near the $200 level.
If SOL can break above this psychological barrier, the analyst predicts a parabolic move into triple-digit territory.
Solana Price Chart
Solana has made a U-shaped recovery following a 60% drop from $262 to $105 between January 18 and April 8. With a 64% gain over the past 34 days, SOL now challenges the 50% Fibonacci retracement level at $183 — the midpoint of the previous decline.
This 50% level also acts as the neckline of the rounding bottom pattern on the daily chart. A breakout above this level could push SOL toward the 100% Fibonacci level at $262, a projected 52% increase.
The RSI has begun to rise after dipping below the 14-day SMA from overbought territory, supporting the bullish outlook. Meanwhile, the 50-day and 100-day EMAs are on the verge of a bullish crossover, which may serve as a buy signal.
On the downside, a breakdown below the 200-day EMA would invalidate the reversal pattern, potentially triggering a decline to the $150 level.
Analyst Predicts Parabolic Rise Above $200
Echoing this bullish sentiment, crypto analyst Ali Martinez recently identified a cup and handle pattern in Solana’s weekly chart. According to Martinez, the handle is forming as a short-term descending channel, with resistance near the $200 level.
If SOL can break above this psychological barrier, the analyst predicts a parabolic move into triple-digit territory.
By:
