Solana Soars 12% as Bulls Charge Toward $200 Breakout—Is This the Next Crypto Mega Rally?

Solana’s price just ripped past resistance with a 12% surge—traders are now betting big on a $200 breakout. Here’s why the smart money’s watching.
The high-speed blockchain’s token is flashing bullish signals, leaving laggards in the dust. While Ethereum maxis cope, SOL’s price action screams momentum.
Key drivers? Institutional inflows, meme coin mania, and that sweet, sweet throughput. Solana’s proving it’s more than just an ‘ETH killer’—it’s a market mover.
Of course, Wall Street’s still ‘discovering’ crypto—right after they finish overcharging clients for index funds. But for once, retail might actually be ahead of the curve.
One question remains: Will SOL smash through $200 or face the cruel reality of crypto gravity? Place your bets.

Key Insights:
- Solana price surged 12% this week and 6% in 24 hours, showing strong upside momentum.
- Over 20 million active addresses signal growing network use and investor interest.
- Solana price prediction targets show $218 as the next resistance; invalidation below $148 may pause the rally.
Solana price is gaining momentum. This week, it jumped 12%. In the last 24 hours, the crypto gained 6%.
Many traders now believe this rally is only the beginning. Some expect it to hit $200 soon. Others say $260 or more is possible in the coming weeks.
Social Buzz Suggests Traders Expect More Upside
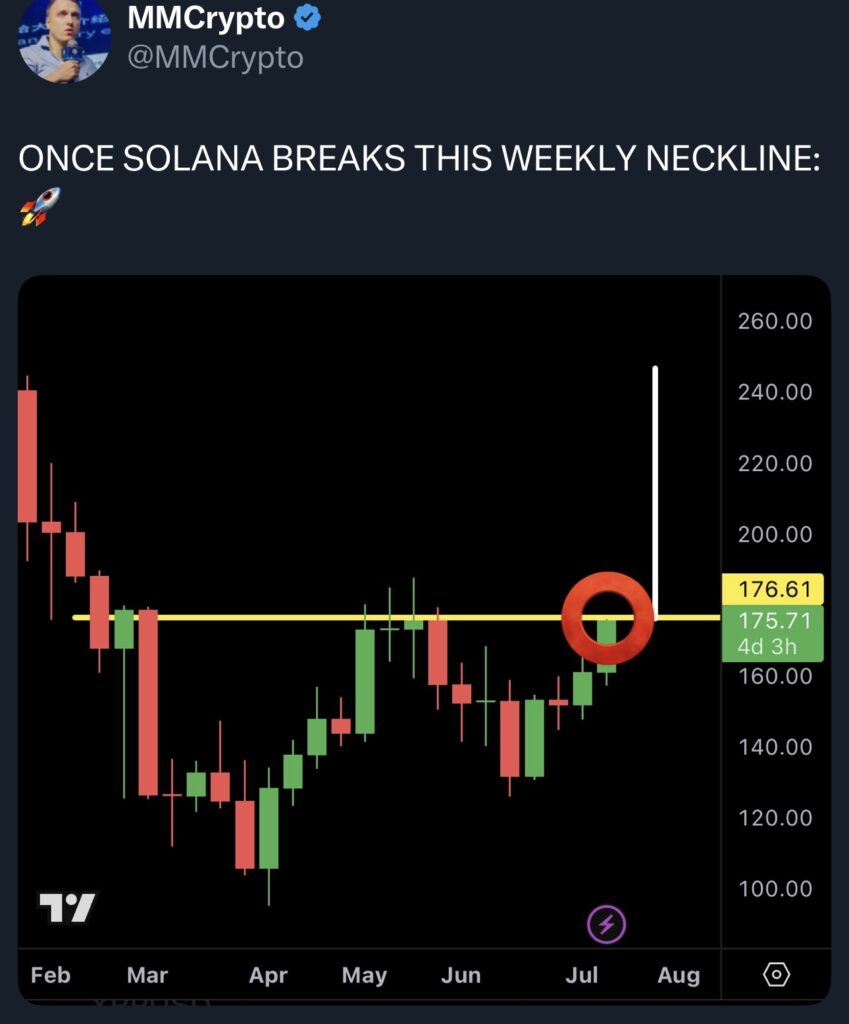
The trader excitement is building on solana crypto, as evidenced by the recent discussions on X. Many are posting bullish Solana charts.
A clean neckline break on the weekly chart is getting attention. This is a technical pattern that often signals a big MOVE up.
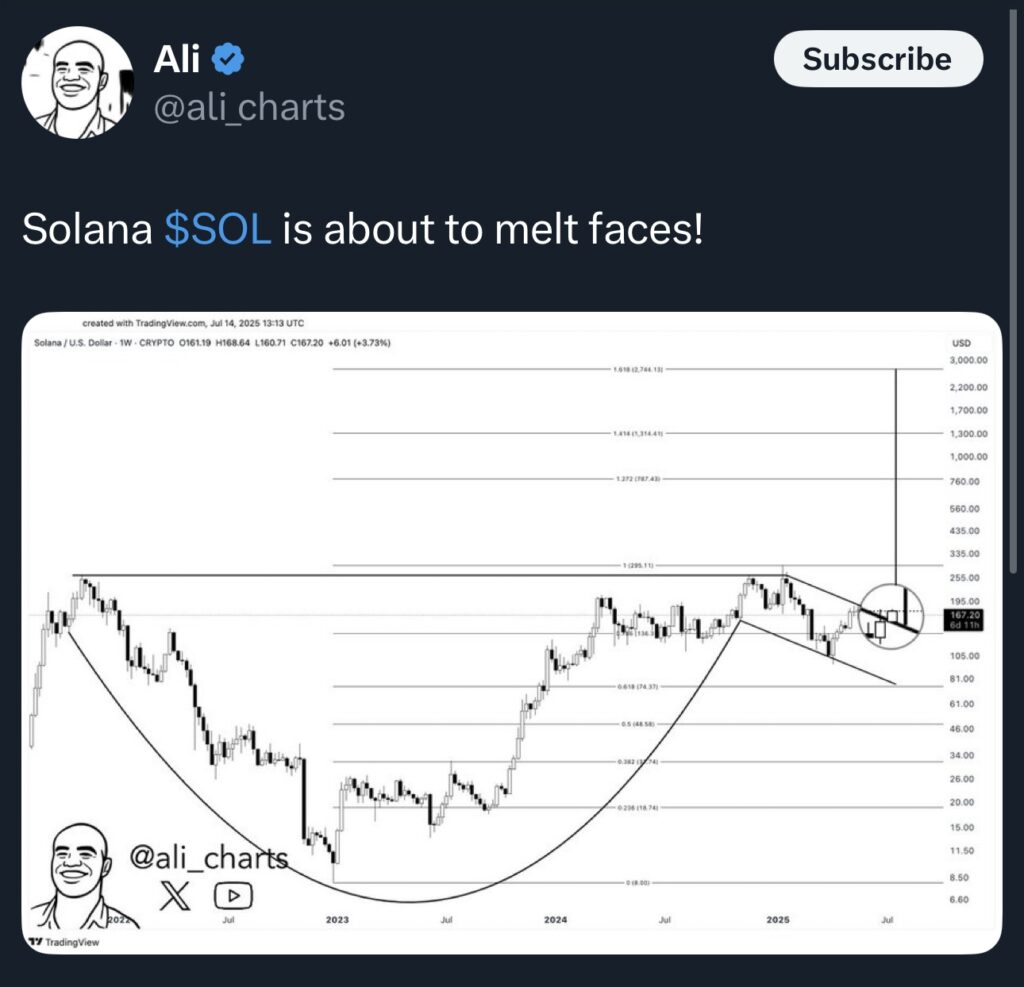
Another popular analyst, Ali Martinez, believes the SOL price is almost out of the handle part of the famed “cup-and-handle” pattern. That again could push the prices to the sky, with him projecting something above $2,000.
Solana’s On-Chain Activity Backs the Price Rally
Solana is not just gaining in price, but also users. Over the last 24 hours, more than 15 million active addresses were recorded.
That’s one of the highest counts in weeks. Even though the levels are not as high as early April, the count is getting higher.

Active addresses mean wallets that interact with the blockchain. This includes trading, staking, or just sending tokens. More active wallets mean more people are using Solana.
This also means that any rally related to SOL isn’t just hype or sentiment-driven. The pattern shows that every solana price prediction level from here is backed by fundamentals.
Spot Exchange Netflows Turn Negative
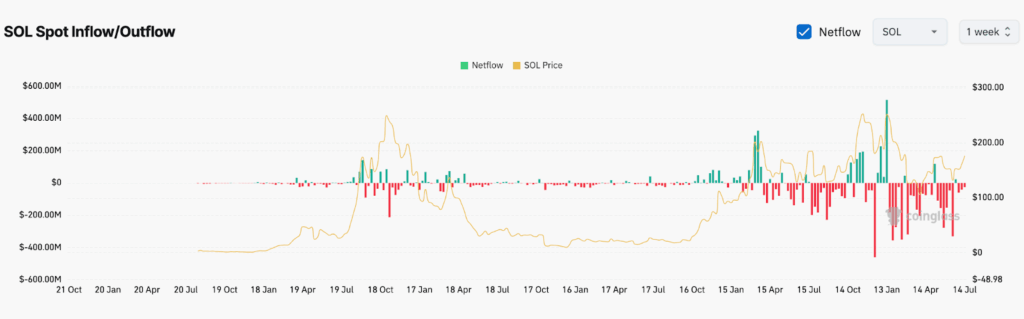
Netflows for Solana are now negative. This means more SOL tokens are leaving exchanges than entering.
When this happens, traders are usually sending coins to private wallets. This is often a sign that they don’t want to sell anytime soon. And less selling pressure is good for the prices.
Netflows indicate what traders are doing. If coins are moving into exchanges, people may want to sell. If coins are leaving, they plan to hold or stake them.
Right now, outflows are around 158,000 SOL per day. That’s a strong sign that holders are confident in the Solana price.
This pattern also showed up before past rallies. In October 2023, a large net outflow was followed by a 30% gain, per the chart. If history repeats, Solana could be setting up for another major leg up.
Fibonacci Points to $218
The trend-based Fibonacci extension shows $218 as the next target. This chart is based on the move from $95 to $187, with a retracement to $126. After that, the price started to rise again.
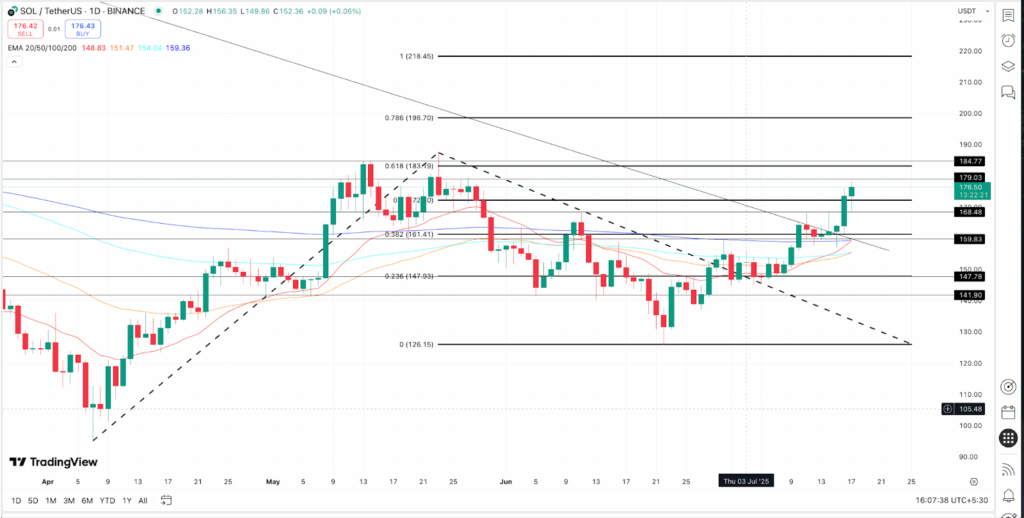
Fibonacci extensions are tools traders use to find where a rally might go next. They look at past moves and project new price levels. The 1.618 level points to $218. If Solana breaks past this, the next big range is between $260 and $280.
But that’s not the most important part. For Solana, all the price-related magic is being done by the almost-completed triple EMA (exponential moving average) golden crossover pattern.
The 20-day EMA has already crossed above the 50-day and 100-day EMAs.
Now traders are just waiting for the 50-day EMA line (orange) to cross above the 100-day line (blue), which could lead to a more aggressive price rally.

The current Solana price is around $177. If this rally continues, the next major target is $218. That’s a 23% jump from here.
If $218 is broken, solana price could quickly move to $260 or higher. X traders are already pointing at the $280 level.
But the bullish setup has a limit. If Solana’s price drops below $148, the rally may fail. This is the invalidation point. If that happens, the crypto could pause or fall before trying again.
