Bitcoin’s Bullish Trajectory: Why $200K BTC Price Target Remains Viable Despite Market Swings

- Bitcoin Technical Analysis: Testing Key Resistance Levels
- Institutional Demand vs. Macro Headwinds
- Bitcoin's Evolving Market Dynamics
- Price Prediction and Key Levels to Watch
- Frequently Asked Questions
As bitcoin consolidates near $118K, institutional accumulation hits $810M in five days while technical indicators flash bullish signals. The BTCC research team analyzes why short-term volatility shouldn't deter long-term investors from the $200K target.
Bitcoin Technical Analysis: Testing Key Resistance Levels
Bitcoin currently trades at $118,109.99, maintaining a healthy 3.7% premium above its 20-day moving average ($113,861.80). The MACD indicator's bullish crossover and positive histogram (-992.52) suggest growing upward momentum. Prices are testing the upper Bollinger Band resistance at $123,572.88 - a breakout above this level WOULD confirm trend continuation.
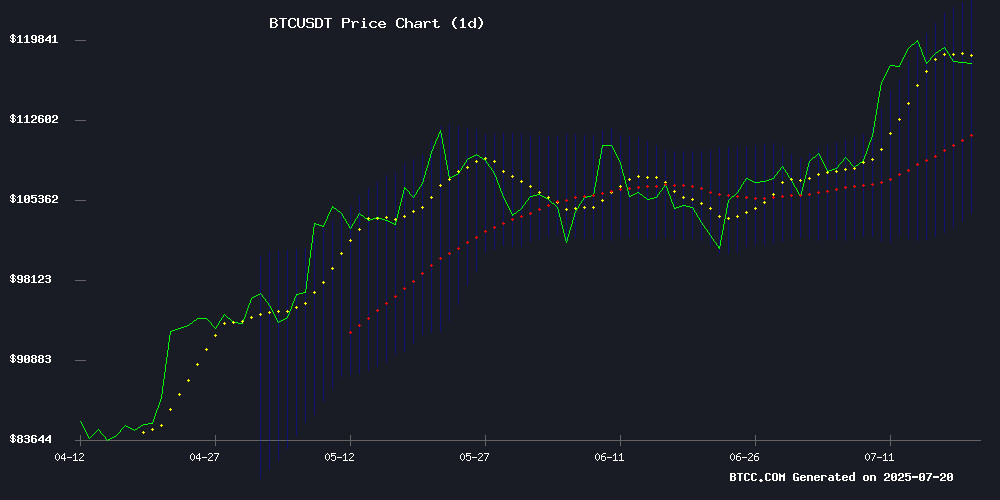
Source: BTCC TradingView
Institutional Demand vs. Macro Headwinds
Corporate Bitcoin accumulation has surged to $810M between July 14-19, with MicroStrategy leading at 4,225 BTC purchased. However, potential UK government sales of seized bitcoin (£5B worth) and Peter Schiff's dollar collapse warnings create competing narratives. Market sentiment remains cautiously optimistic with a 63% bullish/37% bearish institutional split.
Bitcoin's Evolving Market Dynamics
The cryptocurrency continues decoupling from traditional market volatility, with the CBOE VIX correlation weakening significantly. "Where equities traders use VIX as a risk thermometer, crypto markets now respond more to sector-specific catalysts," notes Joao Wedson of Alphractal. This independence emerges during global instability that typically synchronizes asset movements.
Price Prediction and Key Levels to Watch
The BTCC analysis team maintains a 12-month $180K-$200K target despite near-term resistance at $123K. A pullback to $111K Fibonacci support appears likely before the next rally. The logarithmic growth curve pattern suggests current consolidation is a breather rather than reversal, with technicals aligned for upward movement.
| Metric | Value | Implication |
|---|---|---|
| Price vs 20MA | +3.7% | Bullish trend confirmation |
| MACD | Bullish crossover | Momentum shifting upward |
| Institutional Flow | $810M/5 days | Strong smart money demand |
Frequently Asked Questions
What's driving Bitcoin's current price action?
The combination of institutional accumulation ($810M in five days) and technical breakout patterns are primary drivers, though potential UK bitcoin sales create headwinds.
How reliable is the $200K price target?
While not guaranteed, the target derives from logarithmic growth curve analysis and institutional adoption trends. The BTCC team considers it viable within a 12-month horizon.
Should investors be concerned about miner sell pressure?
While 16,000 BTC miner sales create near-term pressure, this represents standard profit-taking behavior during rallies and doesn't alter the long-term bullish case.
How does Bitcoin's current rally compare to previous cycles?
The current 23.48% correction remains shallower than historical 30-80% drawdowns, suggesting stronger underlying market structure this cycle.

Log in to Reply
Log in to comment your thoughtsComments
Related Articles
|Square
Get the BTCC app to start your crypto journey
Get started today Scan to join our 100M+ users