Bitcoin Price Surge Continues – Major Breakout Imminent Within Hours?

Bitcoin's relentless climb shows no signs of slowing—traders are watching the charts with bated breath as we approach what could be the most significant breakout of the year.
The momentum is undeniable
Every resistance level Bitcoin touches turns to support. The pattern's clear: consolidation followed by another leg up. This isn't just retail FOMO—institutional money's flooding in faster than ever.
Technical indicators scream bullish
RSI hovering near overbought territory but refusing to dip. Volume patterns suggest smart money accumulation, not distribution. The charts are painting a picture even traditional finance analysts can't ignore.
When Wall Street finally gets it
They'll call it a discovery—we call it Tuesday. While traditional markets worry about inflation data and Fed meetings, Bitcoin's busy rewriting the rules of value storage. Another day, another ATH—welcome to the future of finance.
Bitcoin Price Eyes More Gains
Bitcoin price started a fresh upward wave above the $116,000 zone. BTC managed to climb above the $116,200 and $116,500 resistance levels.
The bulls were able to push the price above $117,500. The price traded as high as $117,920 and recently started a downside correction. There was a MOVE below the $117,200 level. The price dipped and tested the 50% Fib retracement level of the upward move from the $115,247 swing low to the $117,920 high.
However, the bulls were active near $116,750. Bitcoin is now trading above $116,500 and the 100 hourly Simple moving average. Besides, there is a key bullish trend line forming with support at $115,800 on the hourly chart of the BTC/USD pair.
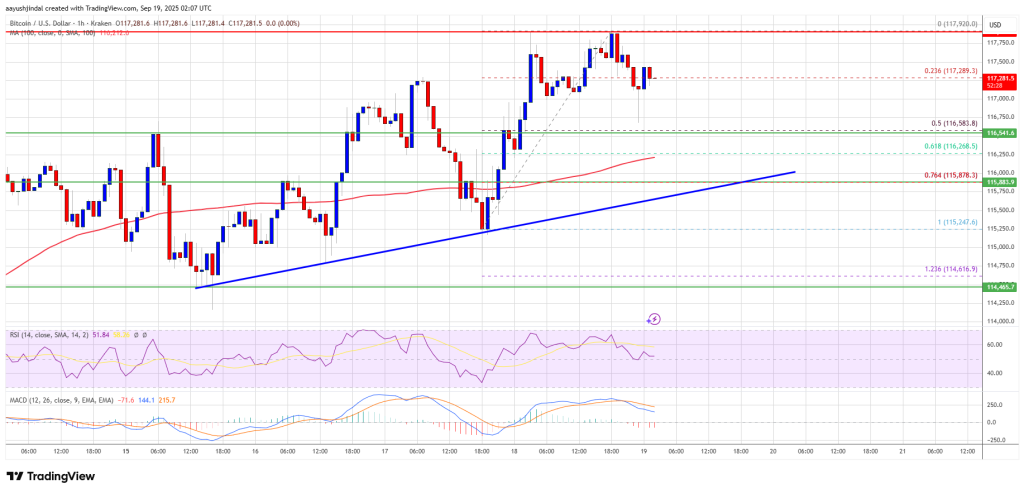
Immediate resistance on the upside is NEAR the $117,500 level. The first key resistance is near the $117,850 level. The next resistance could be $118,000. A close above the $118,000 resistance might send the price further higher. In the stated case, the price could rise and test the $118,500 resistance level. Any more gains might send the price toward the $118,800 level. The next barrier for the bulls could be $119,250.
Another Drop In BTC?
If bitcoin fails to rise above the $117,850 resistance zone, it could start a fresh decline. Immediate support is near the $116,550 level. The first major support is near the $115,800 level or the trend line and the 76.4% Fib retracement level of the upward move from the $115,247 swing low to the $117,920 high.
The next support is now near the $115,250 zone. Any more losses might send the price toward the $114,500 support in the near term. The main support sits at $112,500, below which BTC might decline heavily.
Technical indicators:
Hourly MACD – The MACD is now losing pace in the bullish zone.
Hourly RSI (Relative Strength Index) – The RSI for BTC/USD is now above the 50 level.
Major Support Levels – $116,550, followed by $115,800.
Major Resistance Levels – $117,850 and $118,000.
