Bitcoin Primed for Breakout: Will the Bull Run Reignite After Consolidation?

Bitcoin's price action is coiled like a spring—after weeks of sideways trading, the king of crypto looks ready to make its next move.
The Setup:
A textbook consolidation pattern has emerged, with BTC hovering near key support levels. Traders are watching for a decisive close above resistance to confirm the next leg up.
The Catalyst:
Market sentiment shifted bullish after institutional inflows hit a 3-month high—though skeptics whisper this is just Wall Street's latest 'pump-and-dump' playground.
The Bottom Line:
If Bitcoin clears $70K, all bets are off. But with leverage at record levels, this rocket could either moon or crater faster than a meme stock CEO's reputation.
Bitcoin Price Aims Another Increase
Bitcoin price started a correction phase from the $120,250 resistance zone. BTC dipped below the $118,500 level and tested the $118,000 zone.
There was a MOVE below the 50% Fib retracement level of the upward move from the $116,260 swing low to the $120,237 high. However, the bulls were active near the $117,500 support zone. There is also a key bullish trend line forming with support at $118,200 on the hourly chart of the BTC/USD pair.
Bitcoin is now trading above $118,600 and the 100 hourly Simple moving average. Immediate resistance on the upside is near the $119,300 level. The first key resistance is near the $120,000 level.
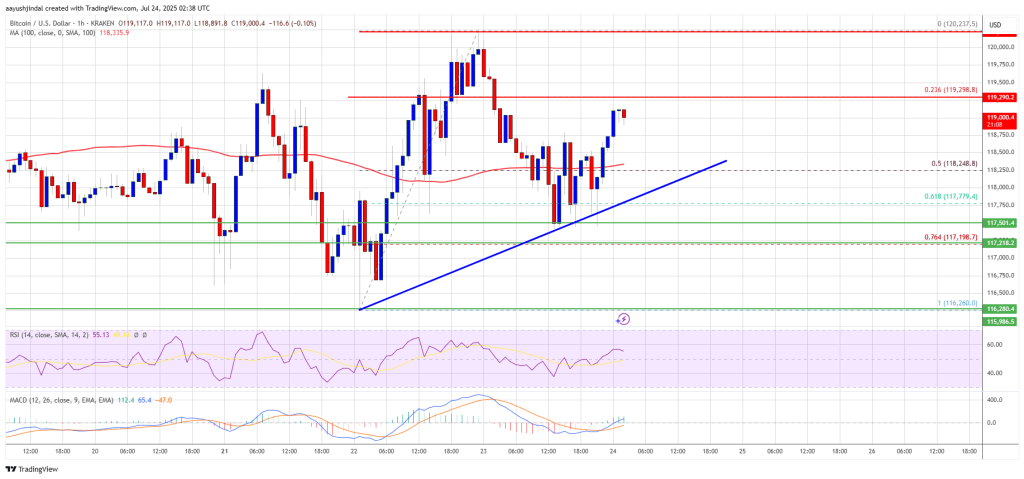
The next resistance could be $120,250. A close above the $120,250 resistance might send the price further higher. In the stated case, the price could rise and test the $122,500 resistance level. Any more gains might send the price toward the $122,500 level. The main target could be $123,200.
Another Decline In BTC?
If Bitcoin fails to rise above the $120,250 resistance zone, it could start another decline. Immediate support is near the $118,500 level and the trend line. The first major support is near the $117,200 level or the 76.4% Fib retracement level of the upward move from the $116,260 swing low to the $120,237 high.
The next support is now near the $116,250 zone. Any more losses might send the price toward the $115,000 support in the near term. The main support sits at $113,500, below which BTC might continue to move down.
Technical indicators:
Hourly MACD – The MACD is now gaining pace in the bullish zone.
Hourly RSI (Relative Strength Index) – The RSI for BTC/USD is now above the 50 level.
Major Support Levels – $118,250, followed by $116,250.
Major Resistance Levels – $119,250 and $120,250.
