Altcoins Bleed as Ethereum Crashes Below $3,700—Yet Memecore and Story Defy the Carnage

Crypto markets got slapped with a reality check today as Ethereum—the blue chip of altcoins—tumbled below $3,700, dragging most of the sector into the red. But not all coins bowed to the sell-off.
Memecore and Story, two dark horses in the race, clung to gains like Wall Street bankers to their bonuses. While ETH’s drop triggered panic sells across DeFi and NFT projects, these outliers shrugged off the bearish sentiment—proving once again that crypto moves on vibes, not fundamentals.
Will the rest of the market recover, or is this the start of another 'healthy correction' (trader copium)? One thing’s certain: when ETH sneezes, altcoins catch pneumonia—unless they’re pumped full of memecoins’ immunity juice.
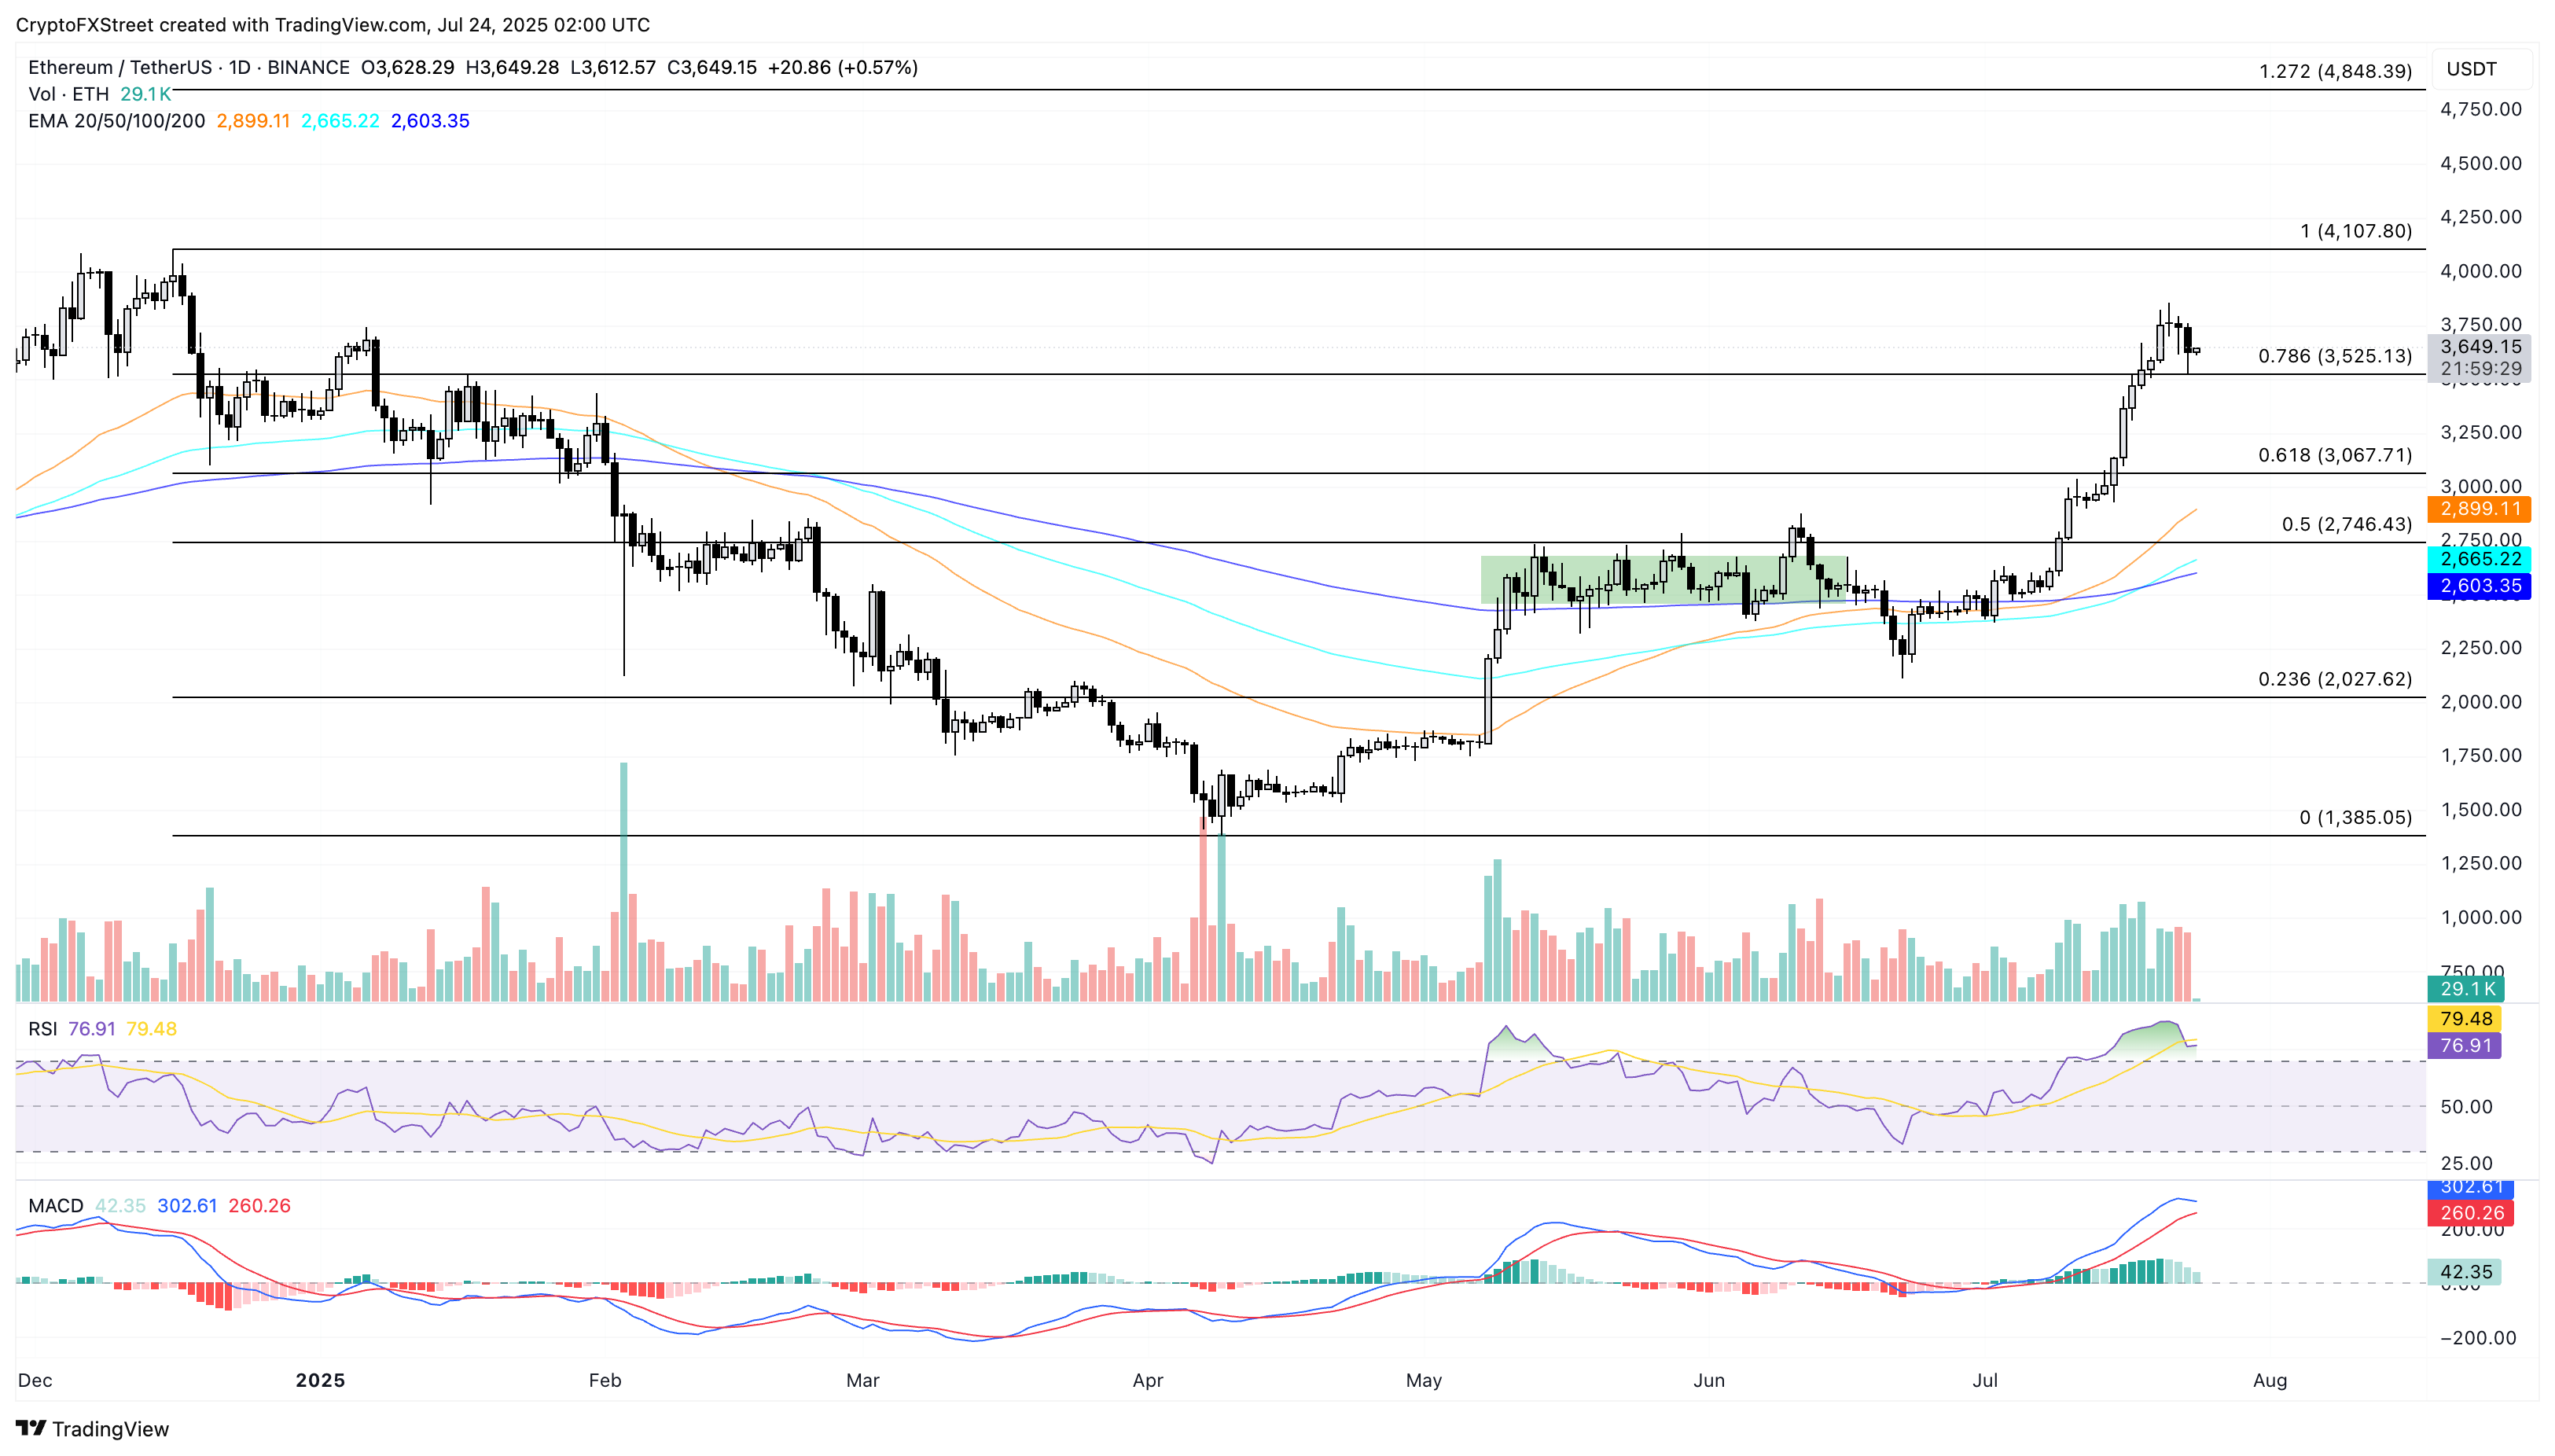
ETH/USDT daily price chart.
On the downside, if ETH marks a decisive close below the $3,525 level, it could extend the declining trend to the 61.8% level at $3,067.
Memecore struggles to escape the sideways range
Memecore edges higher at press time on Thursday within a sideways track on the 4-hour price chart. The recent recovery targets the 23.60% trend-based Fibonacci level at $0.5430 as Memecore inches closer to the $0.5000 psychological level.
A potential close above this level WOULD mark the breakout from a sideways range, potentially targeting the 50% Fibonacci level at $0.7968.
The MACD indicator displays a rising trend of green histogram bars, indicating a growing bullish momentum. Still, the RSI at 64 hovers flat below the overbought boundary line, indicating a stall in buying pressure.
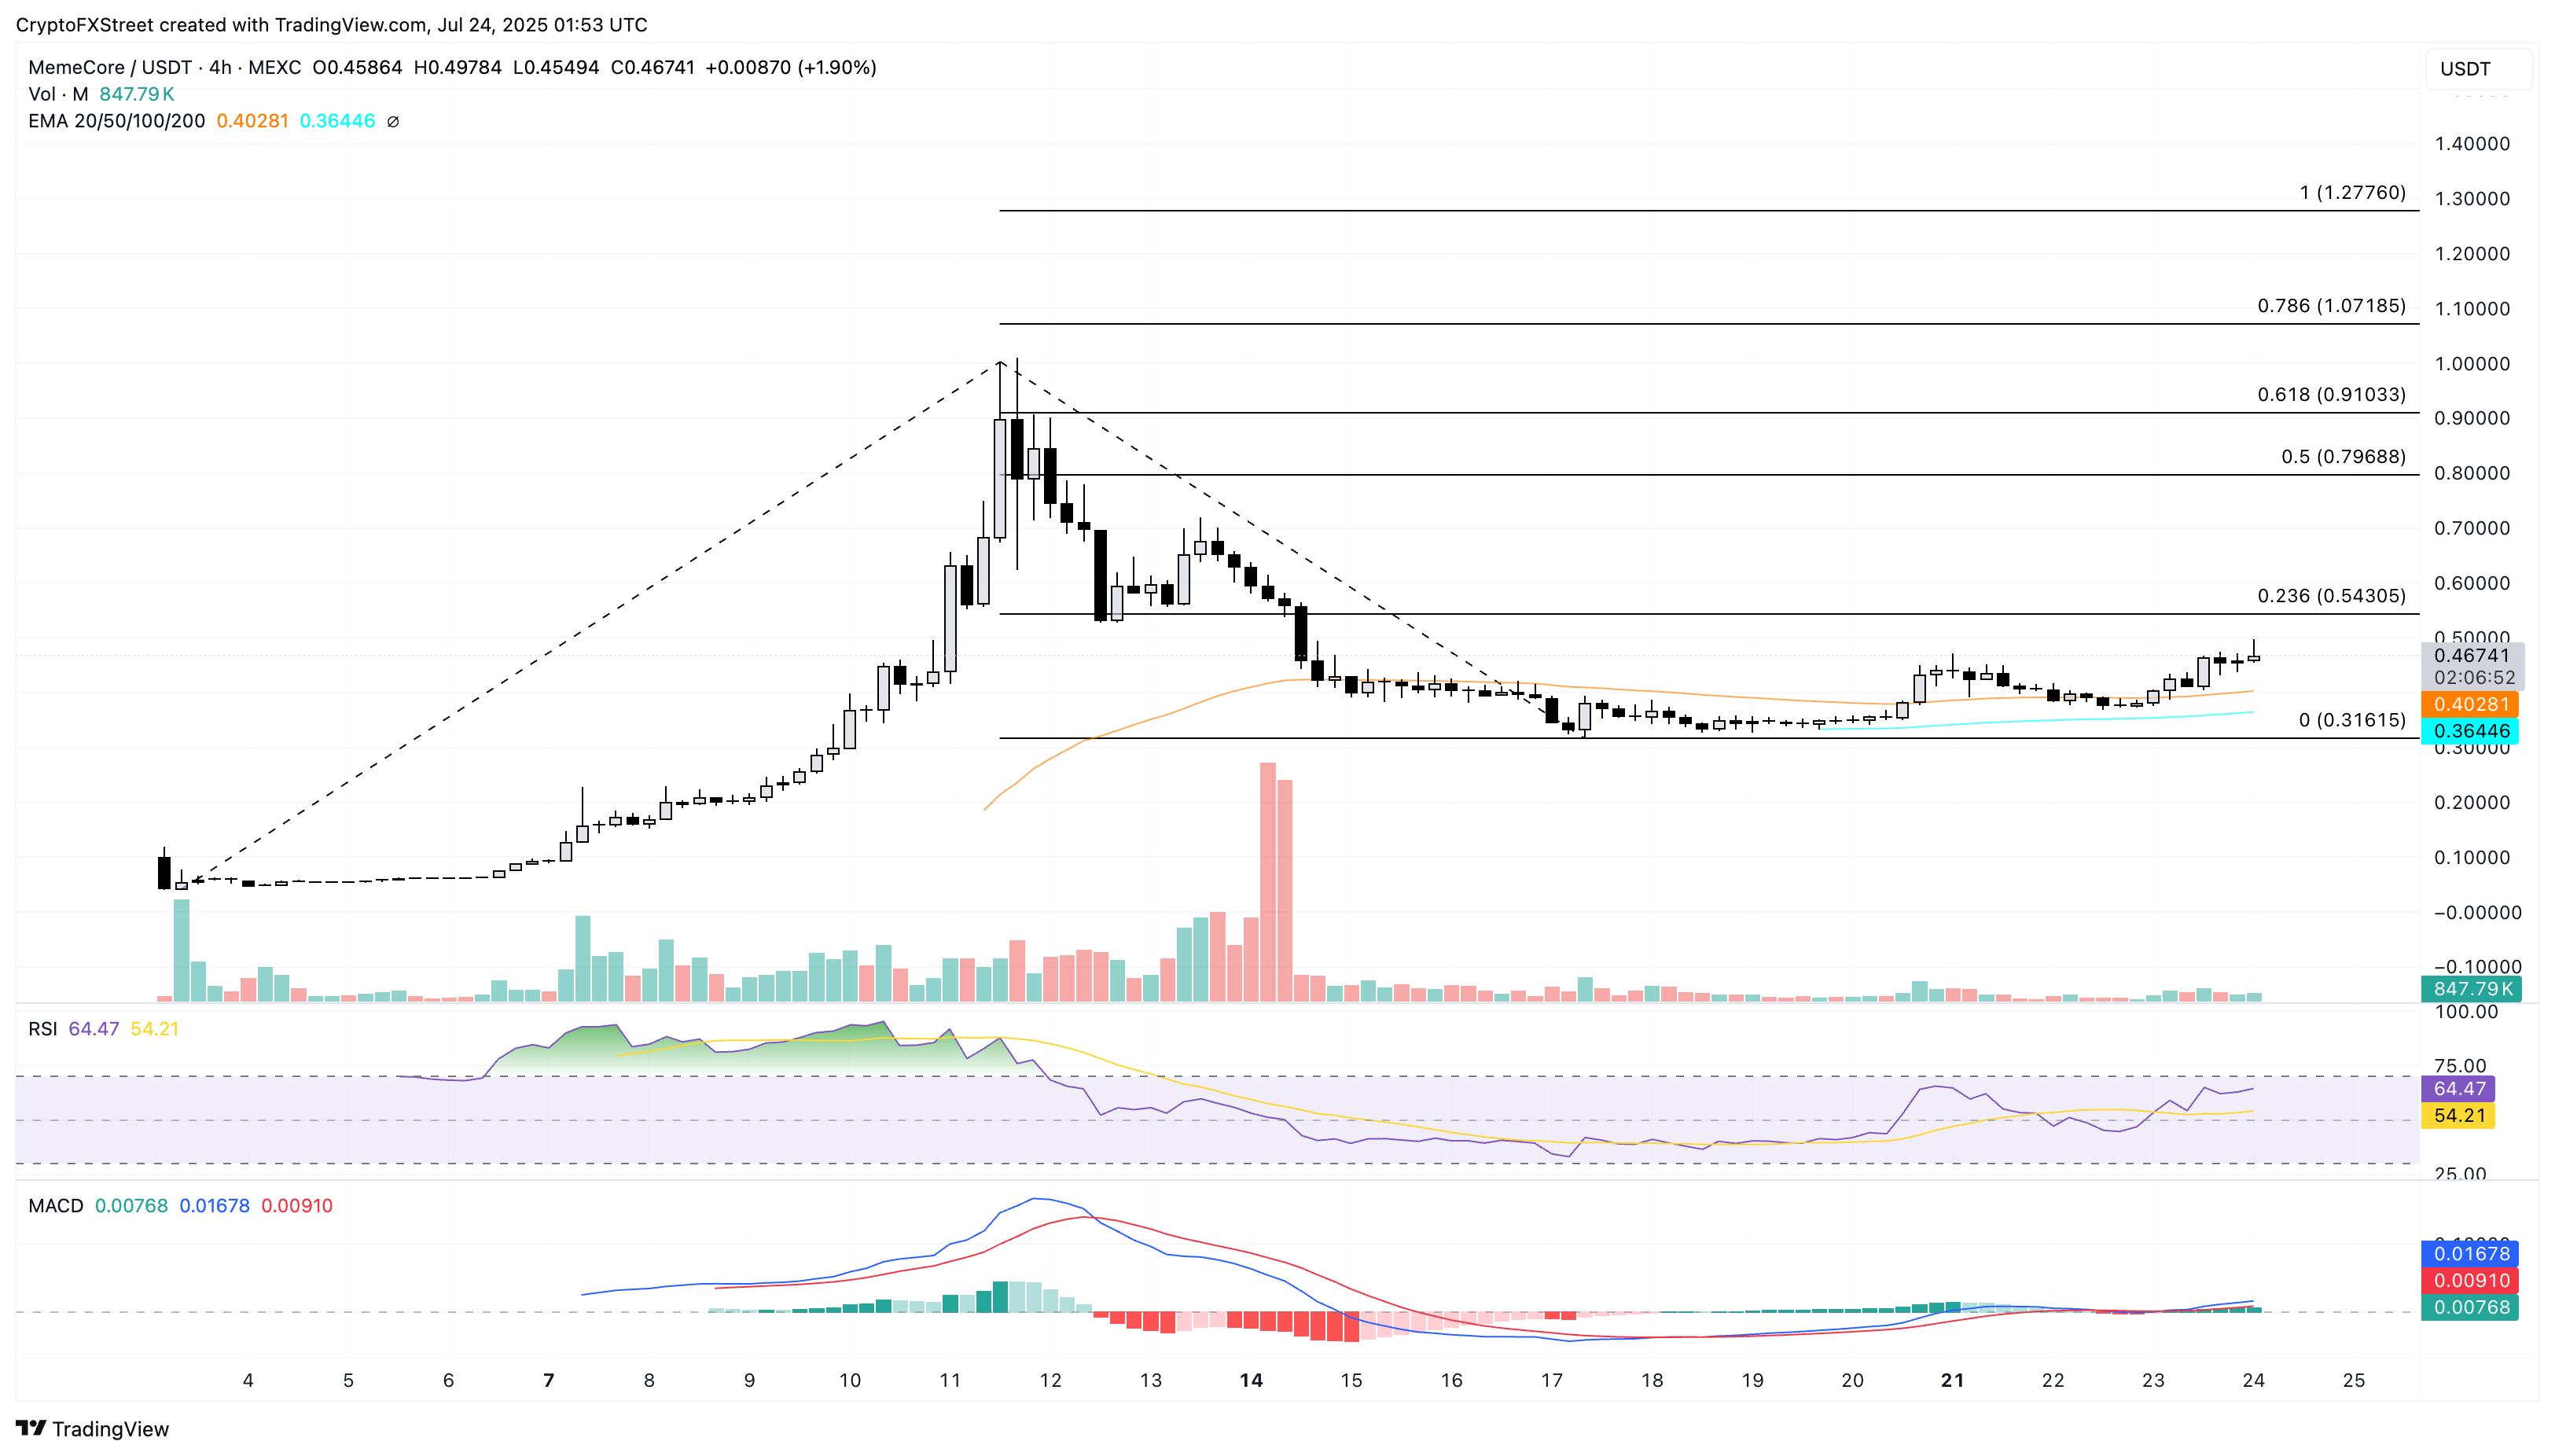
M/USDT 4-hour price chart.
On the flipside, a reversal in Memecore could retest the 50-period Exponential Moving Average (EMA) at $0.4028.
Story’s wedge breakout rally targets $6.16
Story edges higher by nearly 2% at press time on Thursday, printing its fifth consecutive bullish candle. The wedge breakout rally on the daily chart gains traction as it crosses above the $5.00 psychological mark.
IP targets the $6.16 resistance level marked by the close of March 25 as the bullish run continues.
The 50-day EMA draws closer to surpassing the 100-day EMA, a potential buy signal as a short-term rally outpaces the longer-term trend.
The technical indicators suggest a boost in bullish momentum as the green histogram bars surge in the MACD indicator and the RSI at 74 enters the overbought zone amid increased buying pressure.
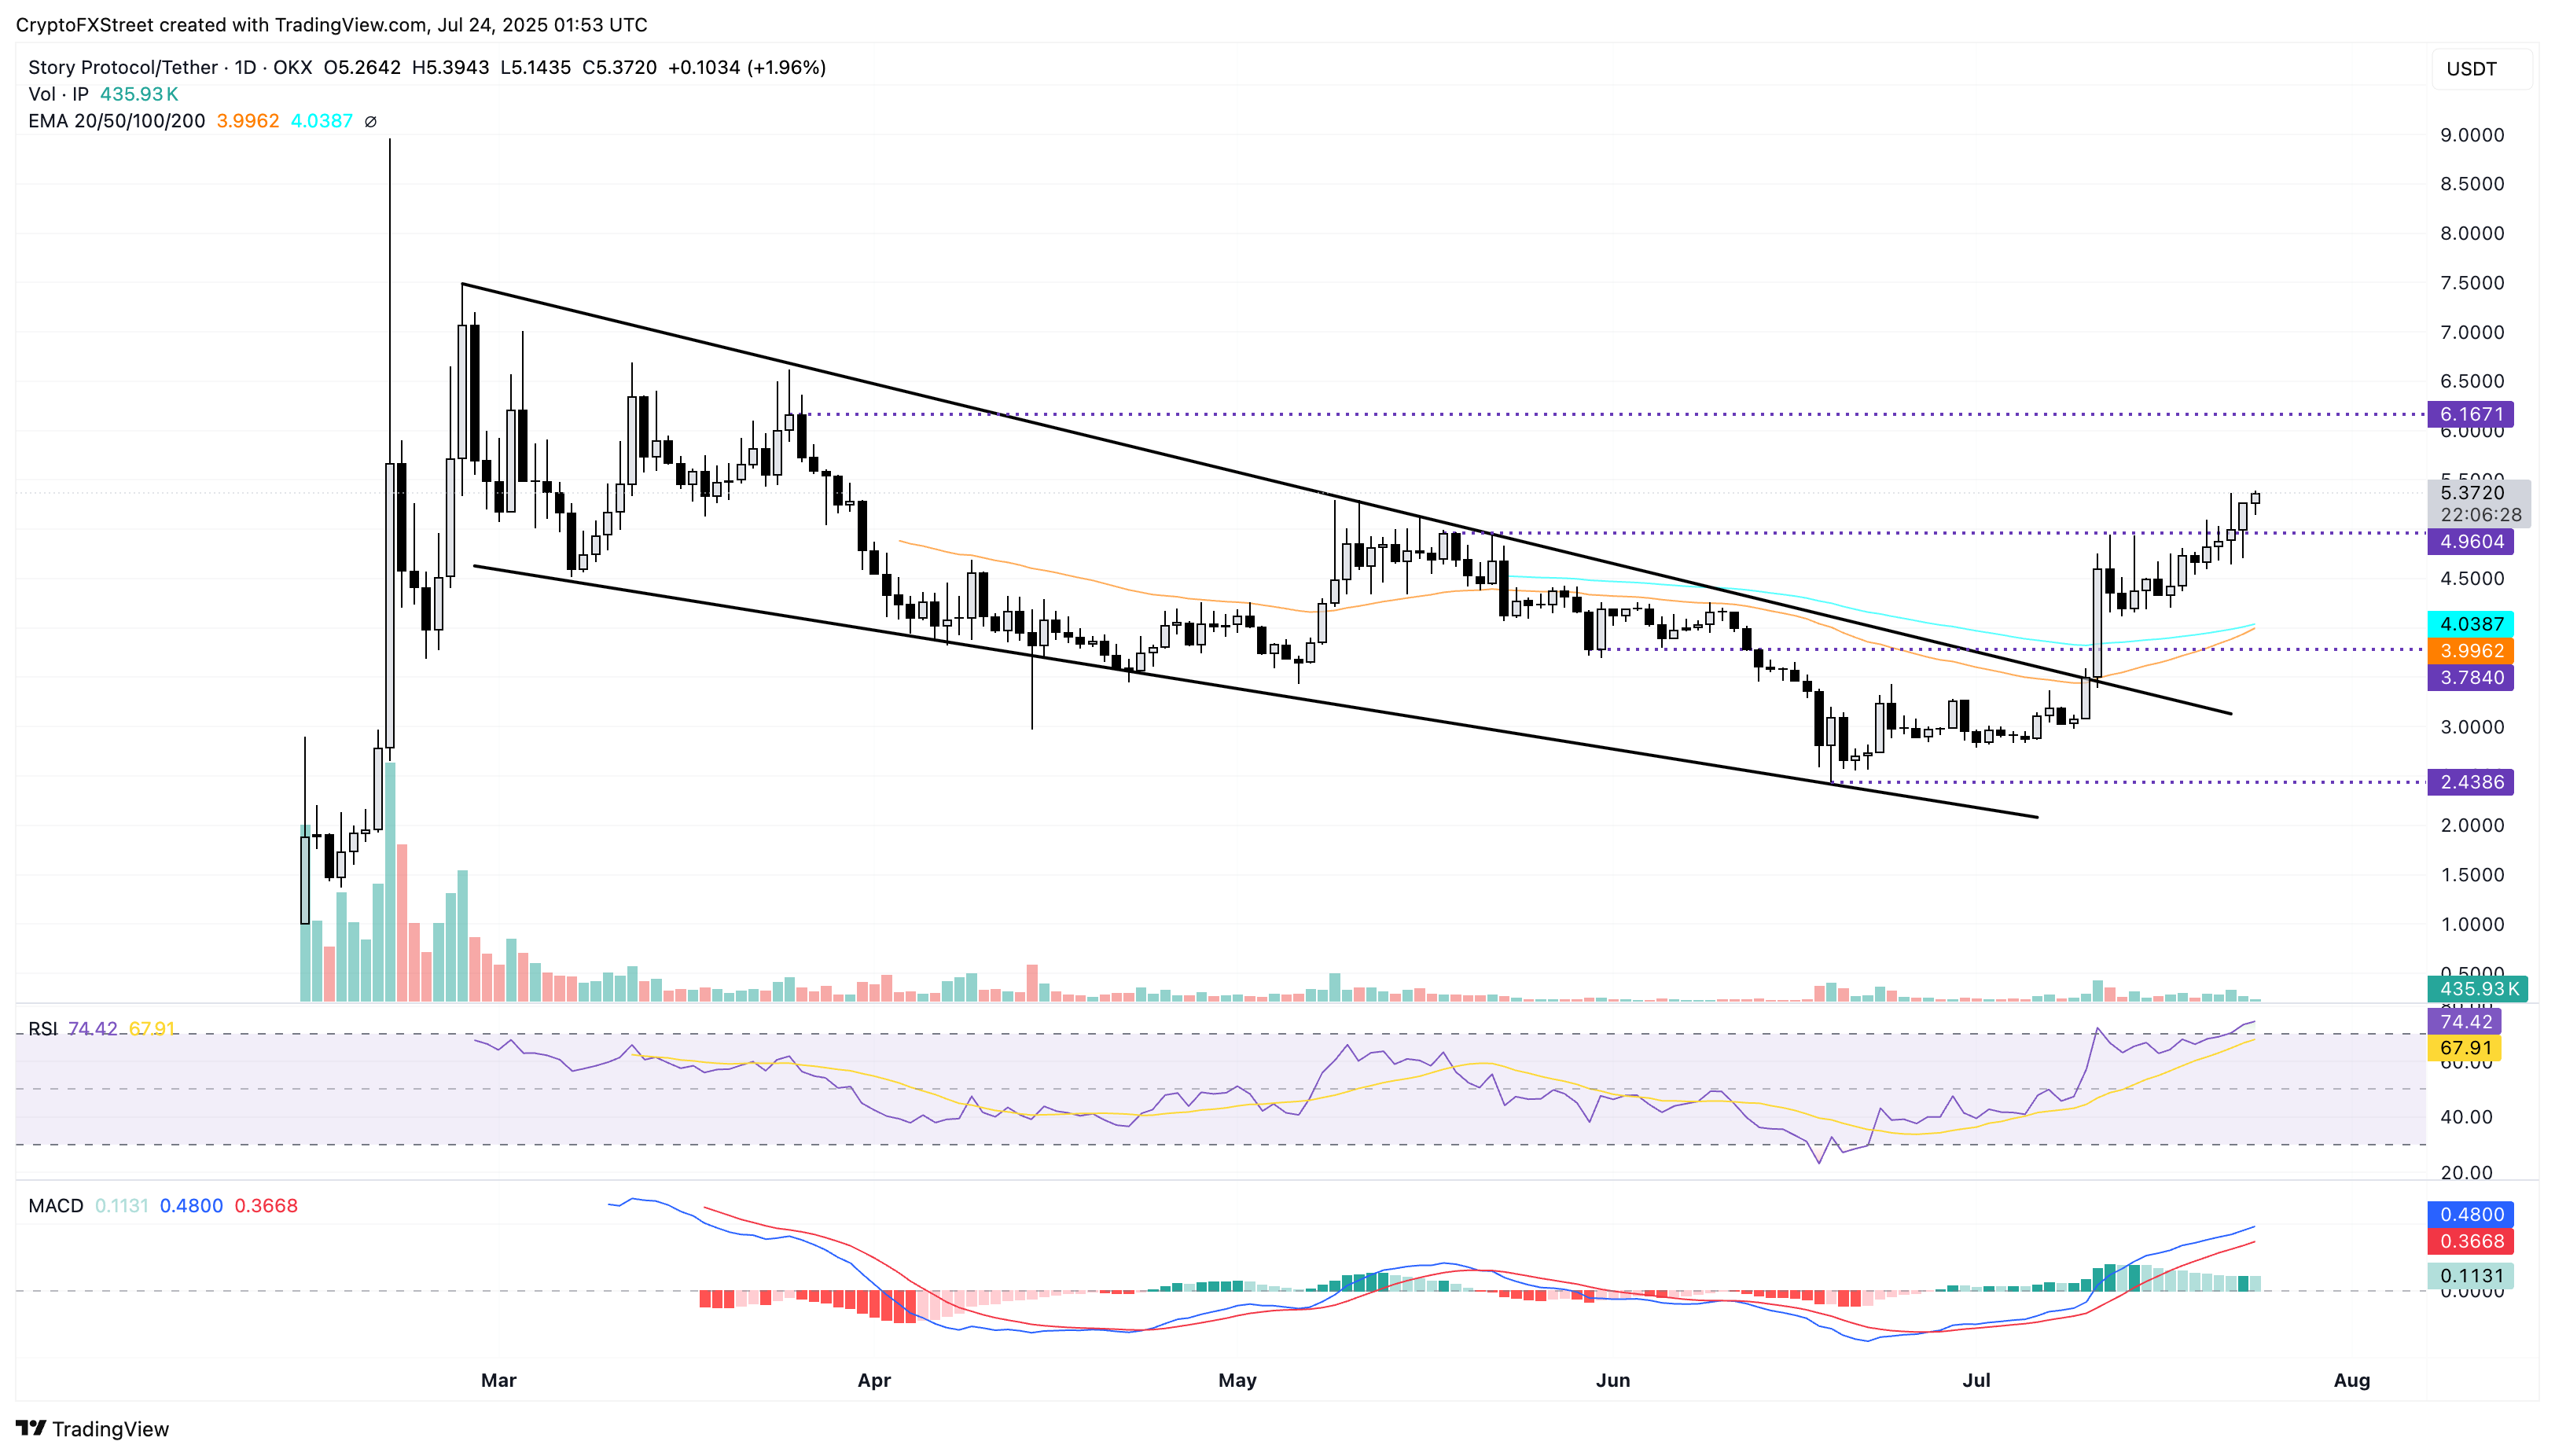
IP/USDT daily price chart.
On the contrary, a reversal in the Story below the $4.96 support level could test the 100-day EMA at $4.03.
