Cardano (ADA) Soars to New Heights as Open Interest Shatters Records – Here’s Why

Cardano’s ADA isn’t just rallying—it’s rewriting the playbook. With Open Interest hitting an all-time high, the smart contract platform is flexing its muscles while Bitcoin maximalists scramble for excuses.
Fueling the fire: Institutional FOMO meets retail frenzy. Traders are piling into ADA futures like it’s 2021 again—except this time, the network actually has working dApps and institutional custody solutions.
The cynical take? Wall Street’s late to another crypto party—as usual. While hedge funds debate ‘digital asset allocation,’ Cardano’s community-built ecosystem keeps minting millionaires the old-fashioned way: early adoption and diamond hands.
Bottom line: When derivatives markets and decentralized innovation collide, you get this kind of explosive growth. Just don’t expect your traditional finance advisor to understand why.
Cardano Open Interest hits $1.66 billion
Futures’ OI in BNB at exchanges rose from $1.18 billion on June 14 to $1.66 billion on Monday, a new all-time high, according to data from CoinGlass. An increasing OI represents new or additional money entering the market and new buying, which could fuel the current ADA price rally.
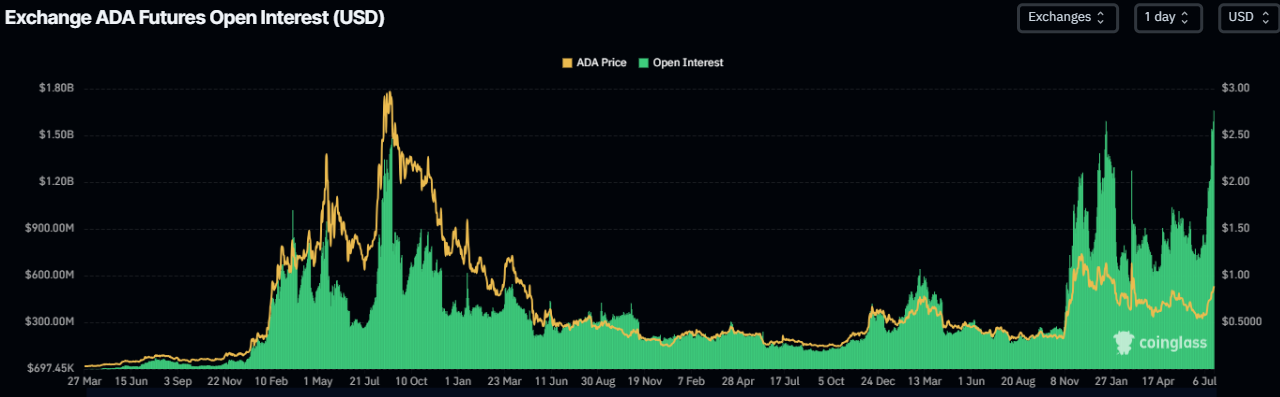
Cardano Open Interest chart. Source: CoinGlass
Another aspect bolstering the platform’s bullish outlook is a recent surge in traders’ interest and liquidity in Cardano’s chain. Token terminal data shows that ADA Chain's weekly token trading volume ROSE from $8.12 billion in the second week of July to $10.30 billion last week, the highest level since mid-March.
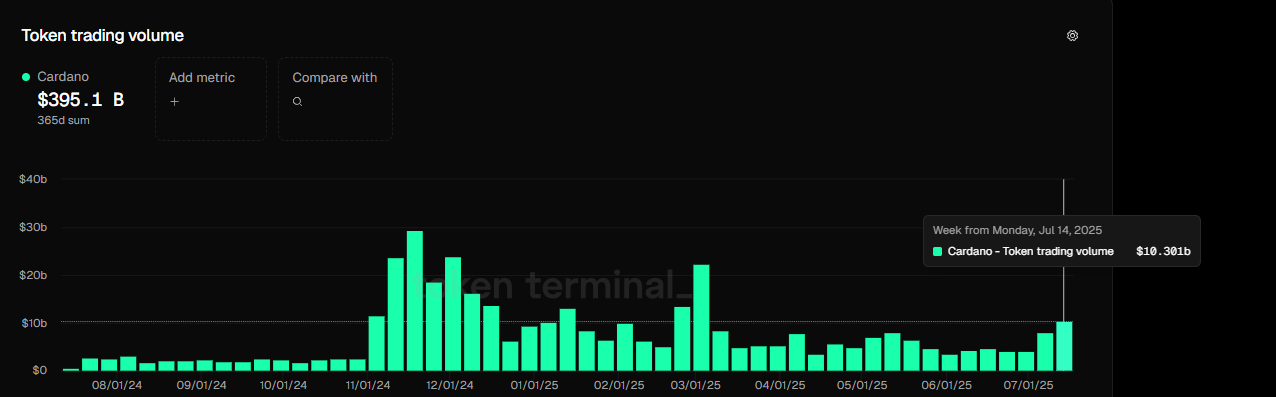
Cardano token trading volume weekly chart. Source: Token terminal
Cardano Price Forecast: Bulls aiming for higher highs
Cardano has rallied for four straight weeks, gaining nearly 60% since mid-June, and closed above the weekly resistance at $0.80 last week. On Monday, it continues to trade higher above $0.88.
If ADA continues its upward trend, it could extend the rally toward $1.01, the 61.8% Fibonacci retracement level drawn from the December high of $1.32 to the February low of $0.50.
The Relative Strength Index (RSI) on the weekly chart reads 58, above its neutral level of 60, indicating that bullish momentum is gaining traction. The Moving Average Convergence Divergence (MACD) showed a bullish crossover last week, giving a buying signal.
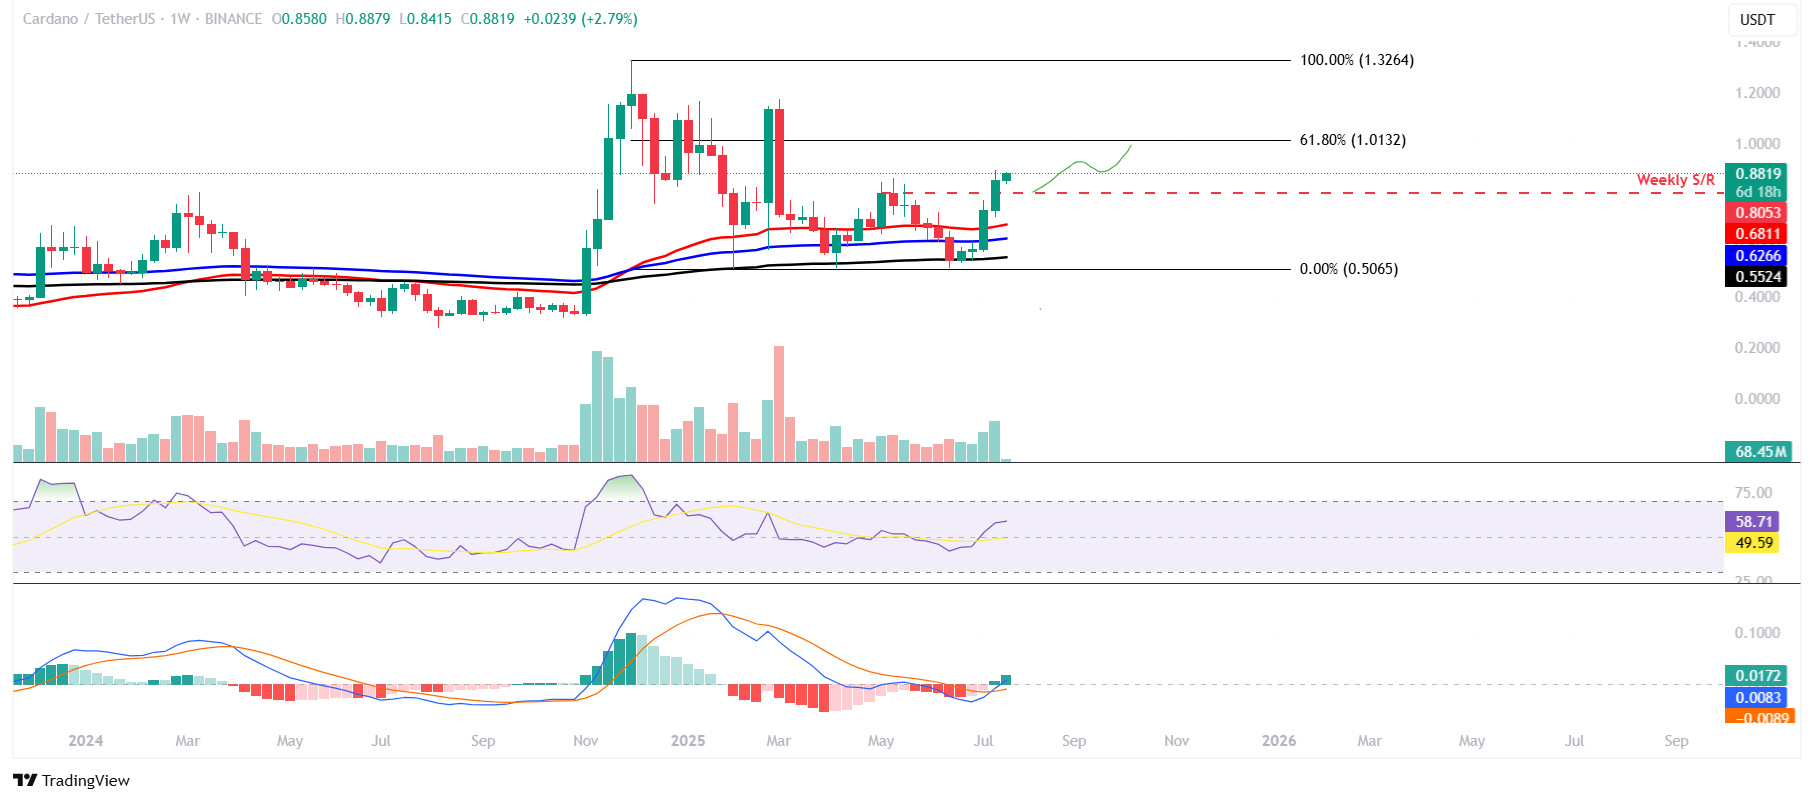
ADA/USDT weekly chart
On the daily chart, ADA broke above the upper resistance trendline of a falling wedge pattern on June 9 and reached its target at $0.84 last week. Moreover, on Sunday, it closed above the daily resistance level, also at $0.84. At the time of writing on Monday, it continues to trade higher above $0.88.
If the daily level at $0.84 holds as support, ADA could extend the rally toward its daily resistance at $1.02, which roughly coincides with the technical level discussed on the weekly chart above. A successful close above this level could extend additional gains toward its next daily resistance at $1.13.
The RSI on the daily chart reads 82, indicating an extreme overbought condition, which traders should be cautious of. The MACD indicator on the daily chart displayed a bullish crossover at the end of June that still holds. The rising green histogram bars above its neutral zero line suggest that bullish momentum is gaining traction.
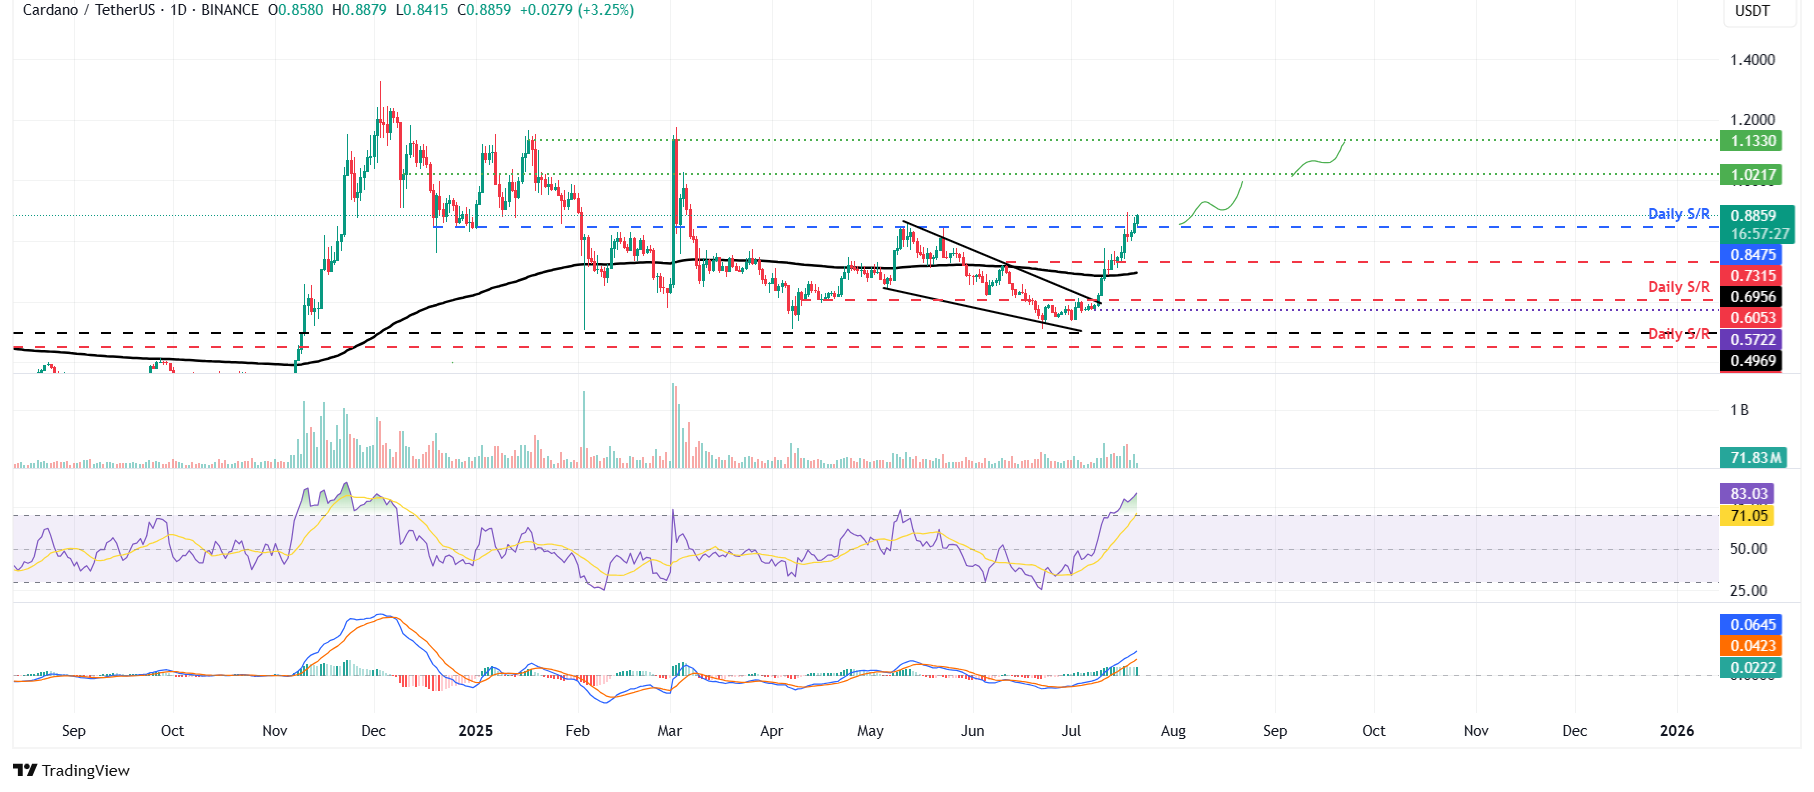
ADA/USDT daily chart
If ADA fails to find support around the daily level at $0.84, it could extend the decline to retest its next daily support at $0.73.
