Dogwifhat (WIF) Primed for 10%+ Rally as Open Interest Explodes to 2025 High

Meme coin mania is back—and this time, it's wearing a hat.
Open interest screams bullish
Futures markets are betting big on WIF, with aggregated open interest hitting its highest level since January. Traders are piling in despite—or perhaps because of—the token's absurdist origins.
Technical setup favors longs
The charts show a clear path to double-digit gains if WIF holds above key support. Of course, in crypto, 'key support' often means 'last week's liquidation zone.'
Just don't tell your CFA
While traditional finance analysts hyperventilate over P/E ratios, WIF proves markets will rally behind literally anything—even a Shiba Inu with digital knitwear.
Dogwifhat Open Interest surge reflects increased optimism
Coinglass’ data shows the WIF Open Interest (OI) reaching a record annual high of $572.11 million, up from $482.89 million on Sunday. Typically, a spike in OI is associated with increased Optimism as capital inflows surge in the derivatives market.
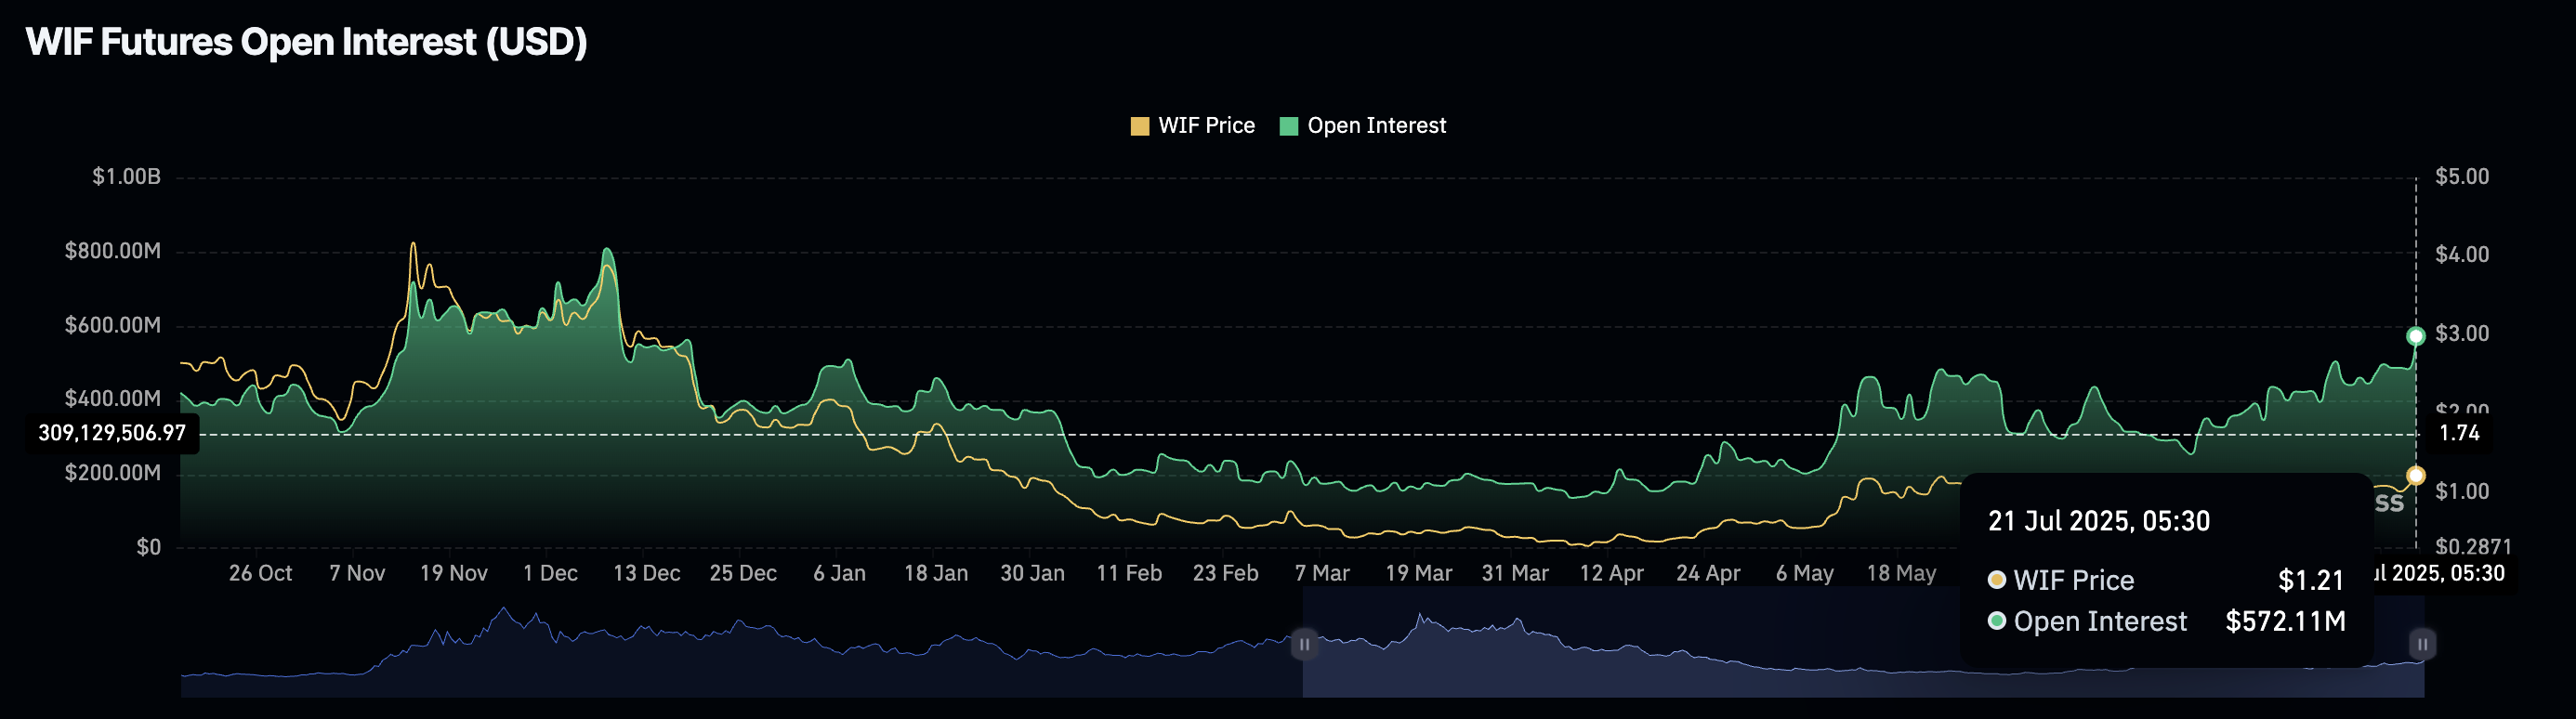
Dogwifhat Open Interest. Source: Coinglass
The OI-weighted funding rate is at 0.0182%, indicating a buying inclination due to increased trading activity. Bulls pay the positive funding rates to align spot and swap prices and offset the imbalance of increased buying in the derivatives market.
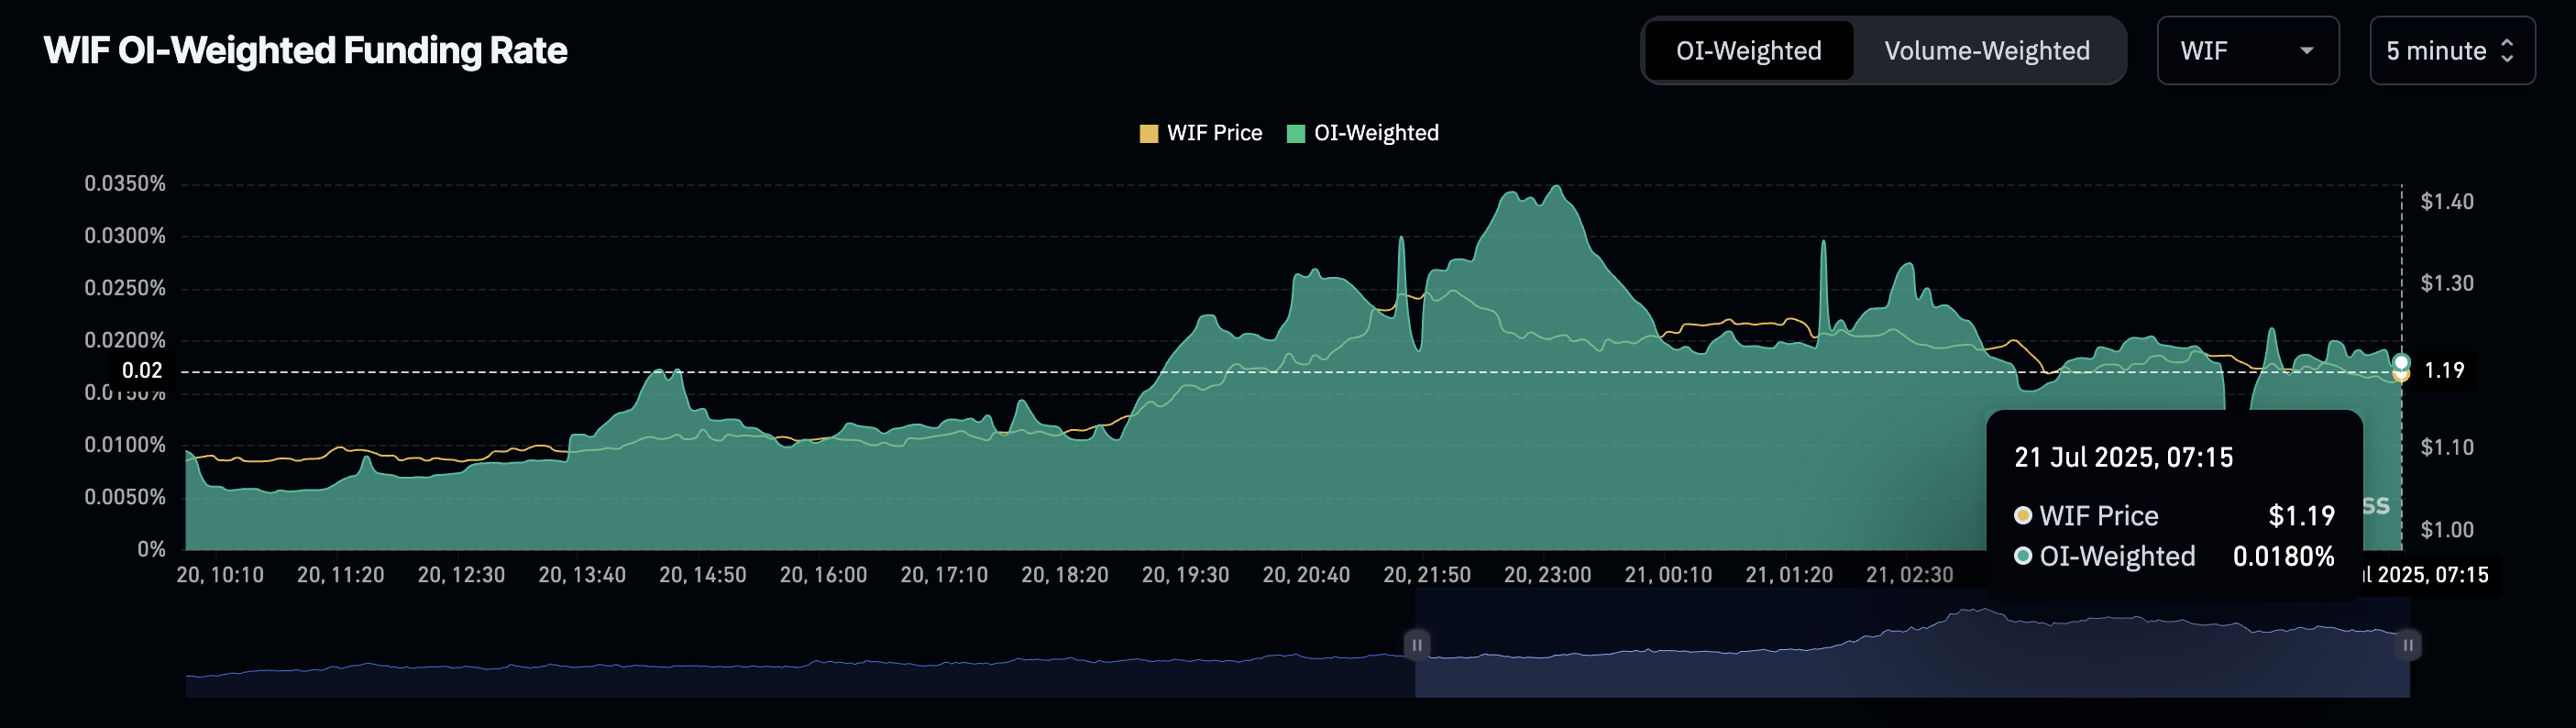
WIF OI-weighted funding rate. Source: Coinglass
Dogwifhat nears crucial resistance, with bulls targeting $1.679
WIF reclaimed the $1 psychological level last week to bounce off 12% higher from the 200-day EMA at $1.066. However, the uptrend faces opposition from the $1.212 level, which aligns with the 50% Fibonacci level drawn from the $4.830 peak on November 13 to the low of $0.304 on April 9.
A decisive close above this level WOULD mark the highest close since January 26. Based on the Fibonacci levels, the 61.8% level, at $1.679, could act as the immediate resistance.
Sidelined investors could consider the 50-day EMA crossing above the 100-day EMA as a buy signal, as the short-term trend outpaces the medium-term. This further increases the chances of a Golden Cross between the 50-day and 200-day EMAs.
The Moving Average Convergence/Divergence (MACD) and its signal line display a rising trend above the zero line. From the same line, the rising green histogram suggests increasing bullish momentum.
The Relative Strength Index (RSI) at 66 on the daily chart inches closer to the overbought boundary line as the buying pressure grows.
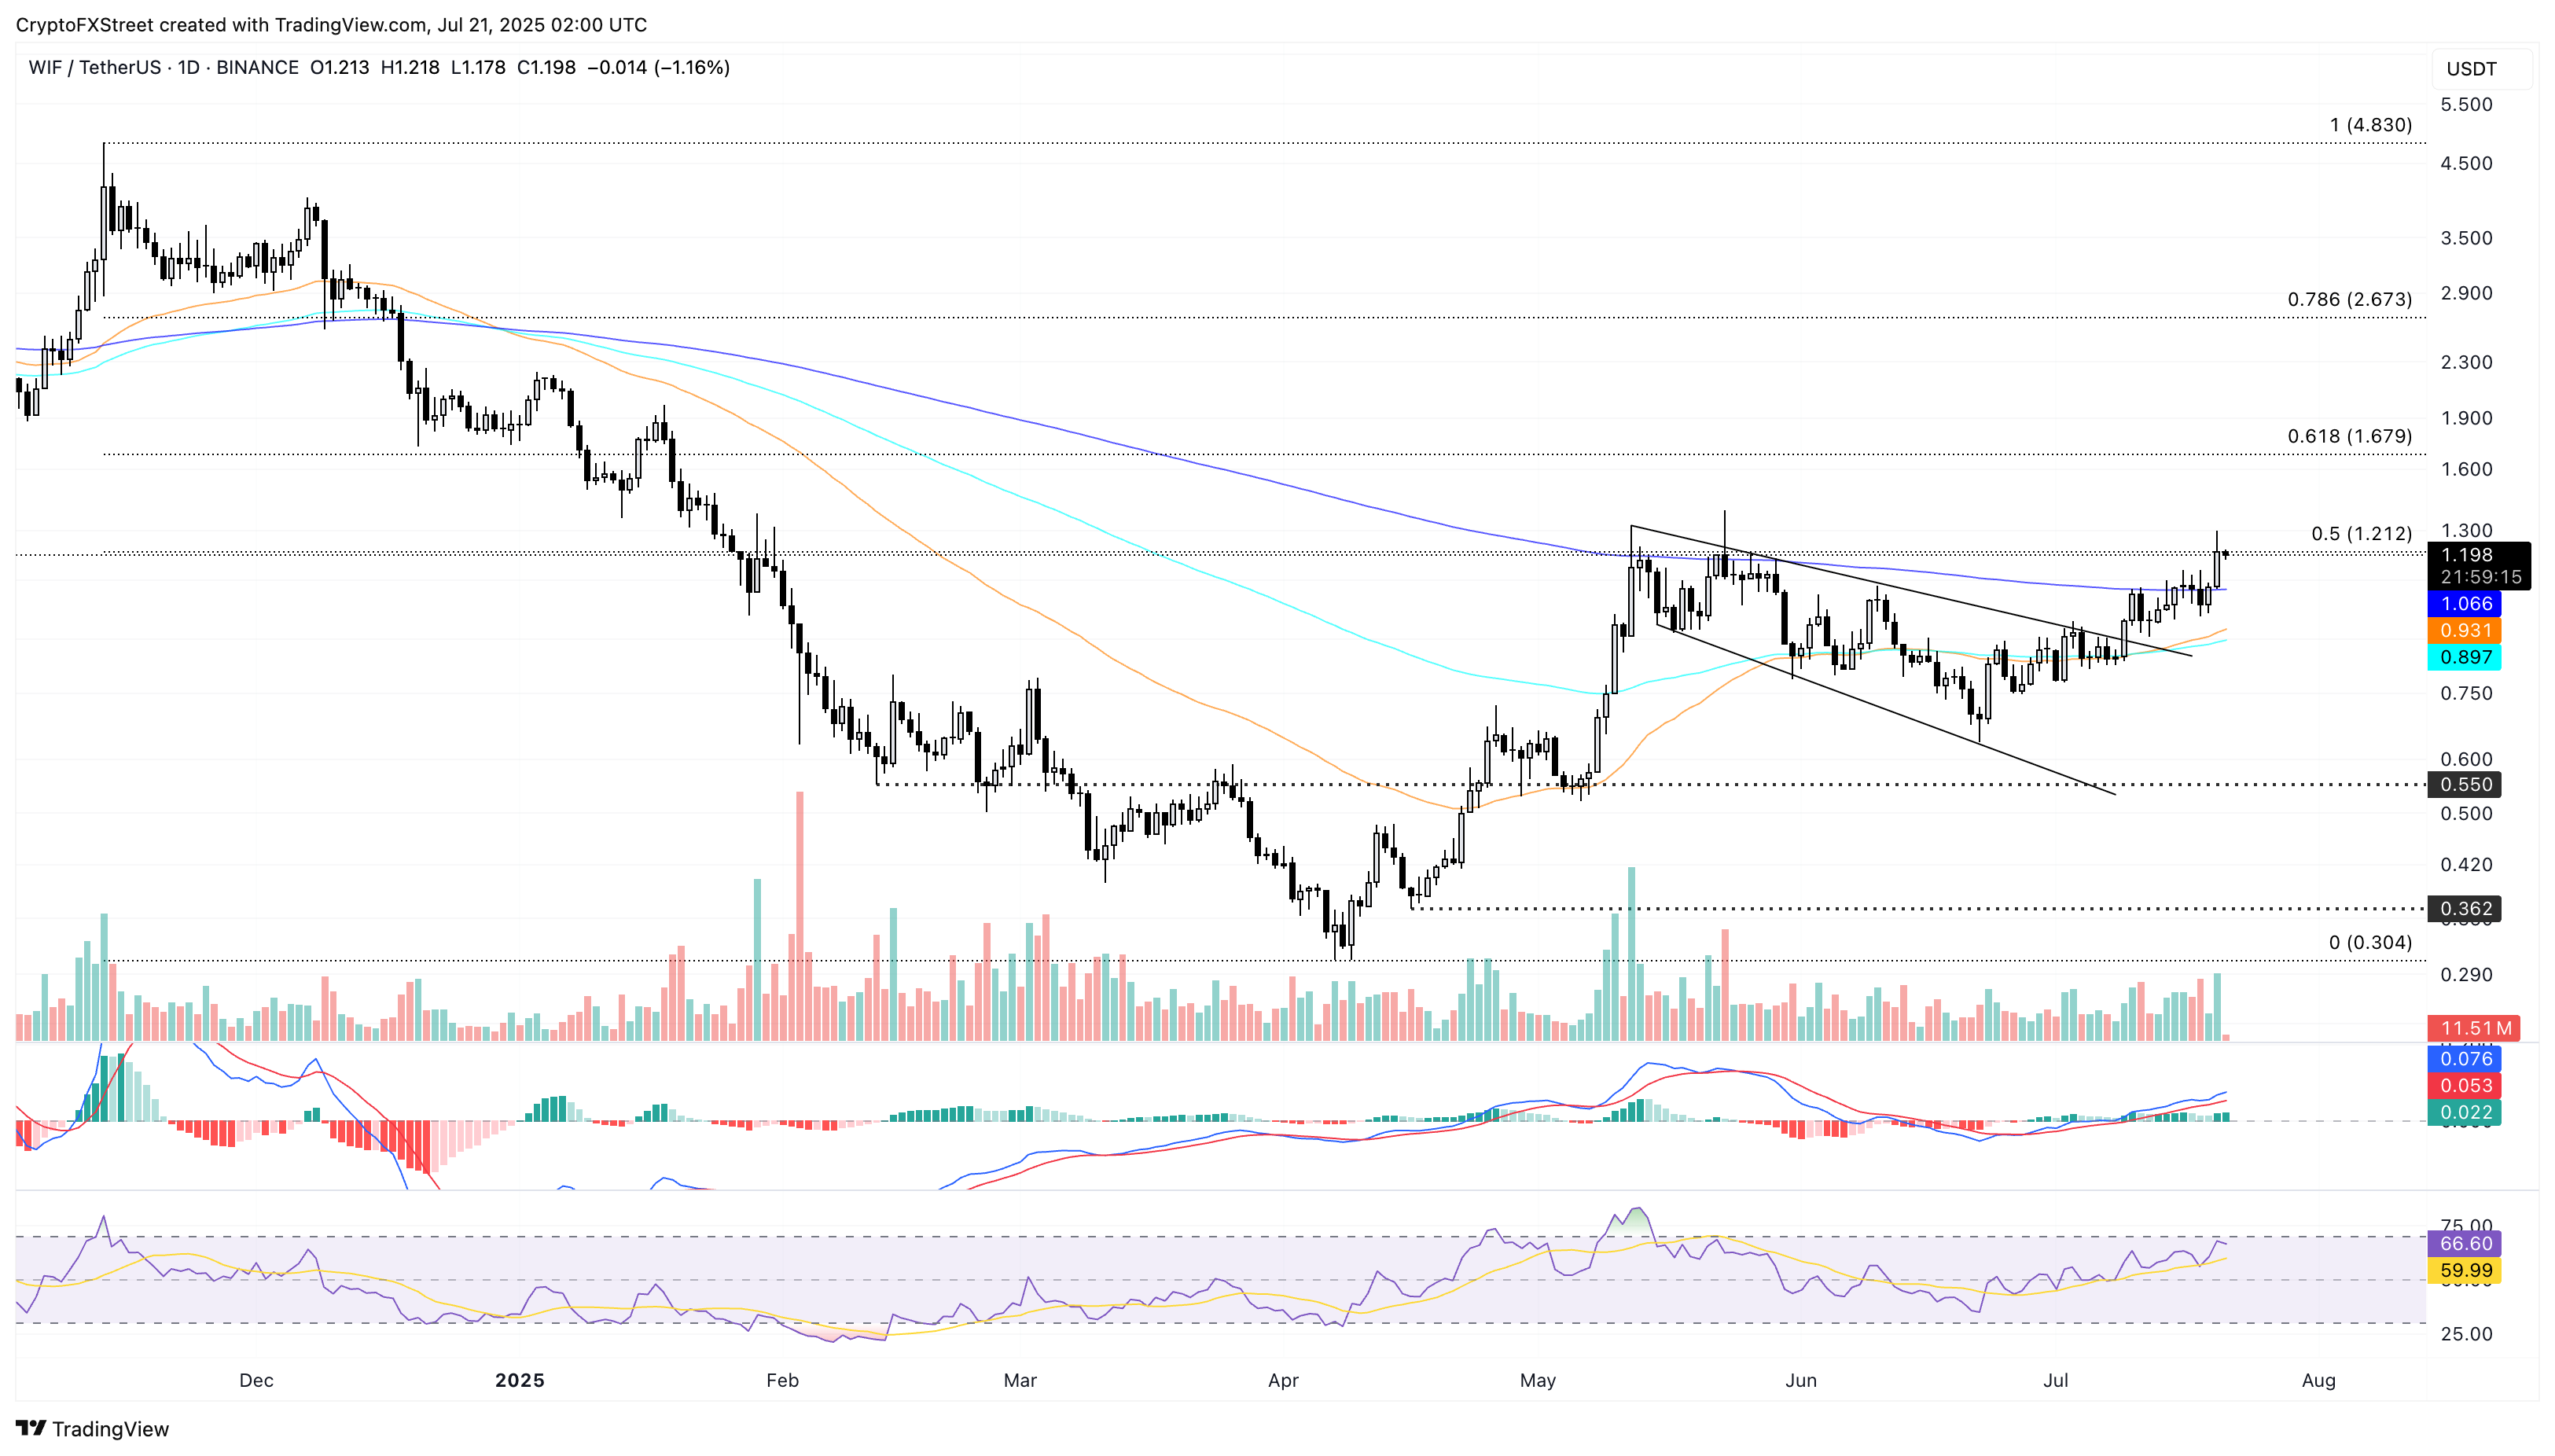
WIF/USDT daily price chart.
On the contrary, a reversal from the $1.212 level would mark another bullish failure that could test the 200-day EMA at $1.066.
