Ethereum (ETH/USD) Elliott Wave Analysis: Bullish Momentum Signals Explosive Rally Ahead

Ethereum's chart is painting a bullish masterpiece—and traders are scrambling to front-run the next leg up.
The Elliott Wave pattern doesn't lie
Clean impulse waves and textbook corrections suggest ETH's consolidation phase is ending. When these sequences appear, they typically precede violent upside—especially when combined with surging DeFi TVL and institutional accumulation.
Watch these key levels
A decisive break above the current range high could trigger algorithmic buying cascades. Meanwhile, Bitcoin maximalists are quietly rotating into ETH futures—the ultimate hedge against their own dogma.
Remember: In crypto, the 'smart money' is usually just the fastest to FOMO. This time might be different. Or not.
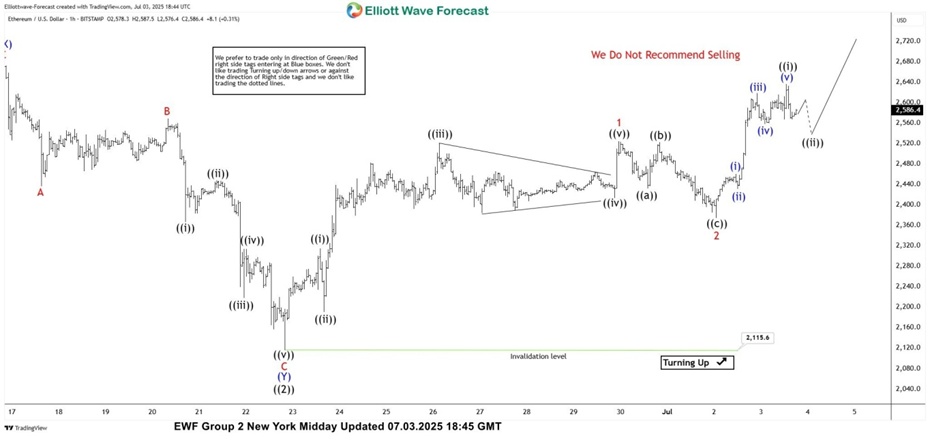
ETH/USD Elliott Wave 1 Hour Chart 07.03.2025
The current analysis suggests that ETHUSD is trading within the cycle from the 2,115.6 low. The price structure is showing higher high bullish sequences. Intraday pullback 2 is counted as completed at the 2,377.5 low. While price stays above that level, we expect further strength in the crypto, within wave 3 red.
As Elliott Wave practitioners know, wave 3 is usually the strongest wave in an impulsive sequence and often reaches the 1.618–2.618 Fibonacci extension of wave 1. In this case, that projects potential targets in the 3,036.5–3,441.1 area.
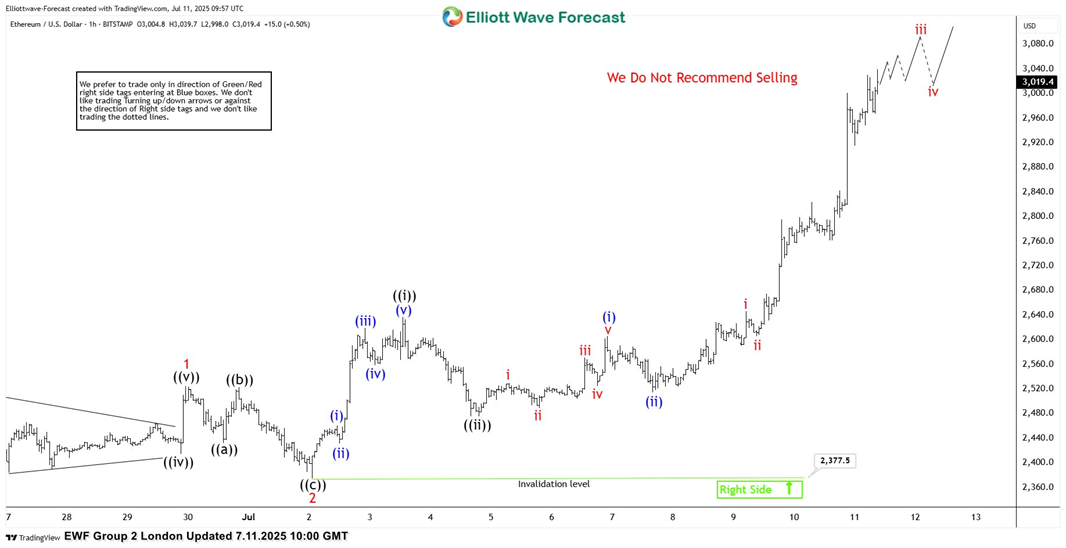
ETH/USD Elliott Wave 1 Hour Chart 07.11.2025
The crypto held above the 2,377.5 low and continued to rally, as expected. The price made a break toward new highs. We do not recommend selling the crypto at this time and favor the long side. Ethereum is reaching our proposed target at 3,036.5–3,441.1 area and should ideally keep trading higher within that zone in upcoming days.
Reminder for members: Please keep in mind that the market is dynamic, and the presented view may have changed in the meantime.