Bitcoin (BTC/USD) Elliott Wave Analysis: Bullish Signals Point to Explosive Rally Ahead

Bitcoin's chart is screaming buy—Elliott Wave patterns confirm the bulls are back in control.
Here's why BTC could be gearing up for its next leg up.
The setup: Classic wave structures suggest we're in the early stages of a powerful upward sequence. Forget the naysayers—technical signals trump Wall Street's 'cautious optimism' every time.
Market pulse: Traders stacking satoshis while institutional players still debate 'digital gold' narratives. Same old story—retail spots the trend first.
Bottom line: When the waves align, you ride the tide. Just don't be the suit left explaining why you waited for 'regulatory clarity' at $100K.
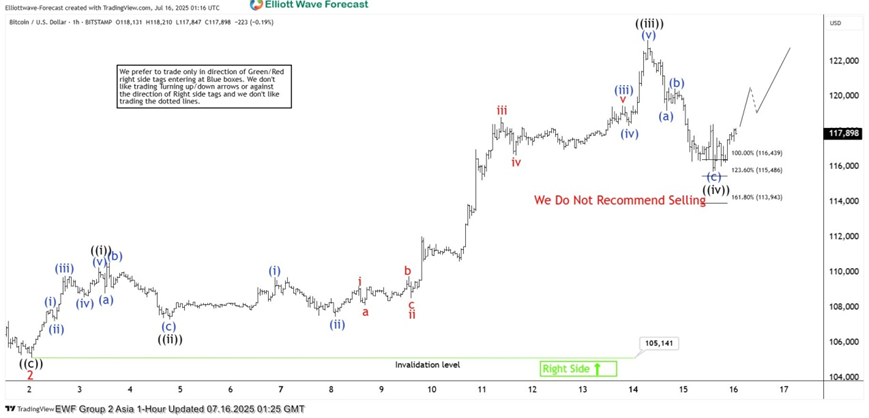
BTC/USD Elliott Wave 1 Hour Asia Chart 07.16.2025
The cycle from the 105,141 low appears to be unfolding as a 5-wave pattern. BTCUSD has completed a clear 3-wave pullback, which we label as wave ((iv)). The price has reached the equal legs area at 116,439–115,486 and is already showing a reaction from that zone.
We do recommend shorting at this stage and continue to favor the long side. Ideally, we’d like to see further separation from the recent low to confirm that the next leg higher is in progress.
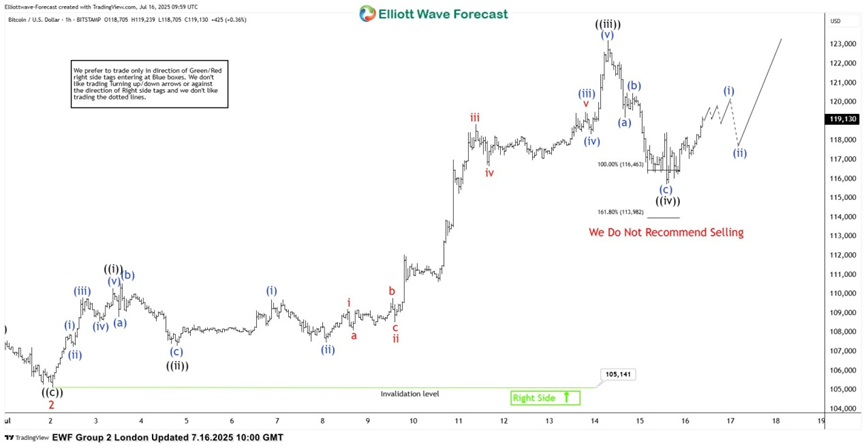
BTC/USD Elliott Wave 1 Hour London Chart 07.16.2025
Bitcoing keeps progressing higher from the equal legs area. While above 115,826 low, Elliott Wave count suggests BTCUSD is have wave ((v)) is in progress, targeting 125,014-127,884 area next.
Reminder for members: Please keep in mind that the market is dynamic, and the presented view may have changed in the meantime.