🚀 Crypto Trend Reversal Alert: BONK, TIA, WIF Surge 20%+ – Is the Bear Market Over?

Memecoins and altcoins stage a comeback as traders chase momentum.
The bottom feeders are feasting
After months of sideways action, speculative assets roar back—because nothing fuels a rally like traders desperate to recoup losses. BONK’s 25% pump smells like coordinated accumulation, while WIF’s breakout suggests degenerate gambling is back in fashion.
Infra plays join the party
TIA’s 18% surge hints at renewed interest in modular blockchains—or just proof that even the ‘serious’ projects need meme-adjacent price action to get noticed these days.
The cynical take
Another dead cat bounce? Probably. But in crypto, you don’t need fundamentals—just greater fools and leveraged longing. Watch those liquidation levels.
BONK’s wedge breakout rally eyes further gains
Bonk edges higher by over 6% at press time on Thursday, extending the 15% growth from the previous day. Further up, the meme coin extends the breakout rally of a falling wedge pattern as previously reported by FXStreet.
BONK nears the $0.00001734 level, aligning with the 50% Fibonacci retracement level drawn from the April 7 low of $0.00000886 to the May 12 high of $0.00002581. An extension above this level with a decisive daily close could extend the uptrend towards the 78.6% Fibonacci level at $0.00002218.
The technical indicators suggest a shift in momentum as the Relative Strength Index (RSI) crosses above the halfway line to 58 while the Moving Average Convergence/Divergence (MACD) indicator and its signal line rise towards the zero line.
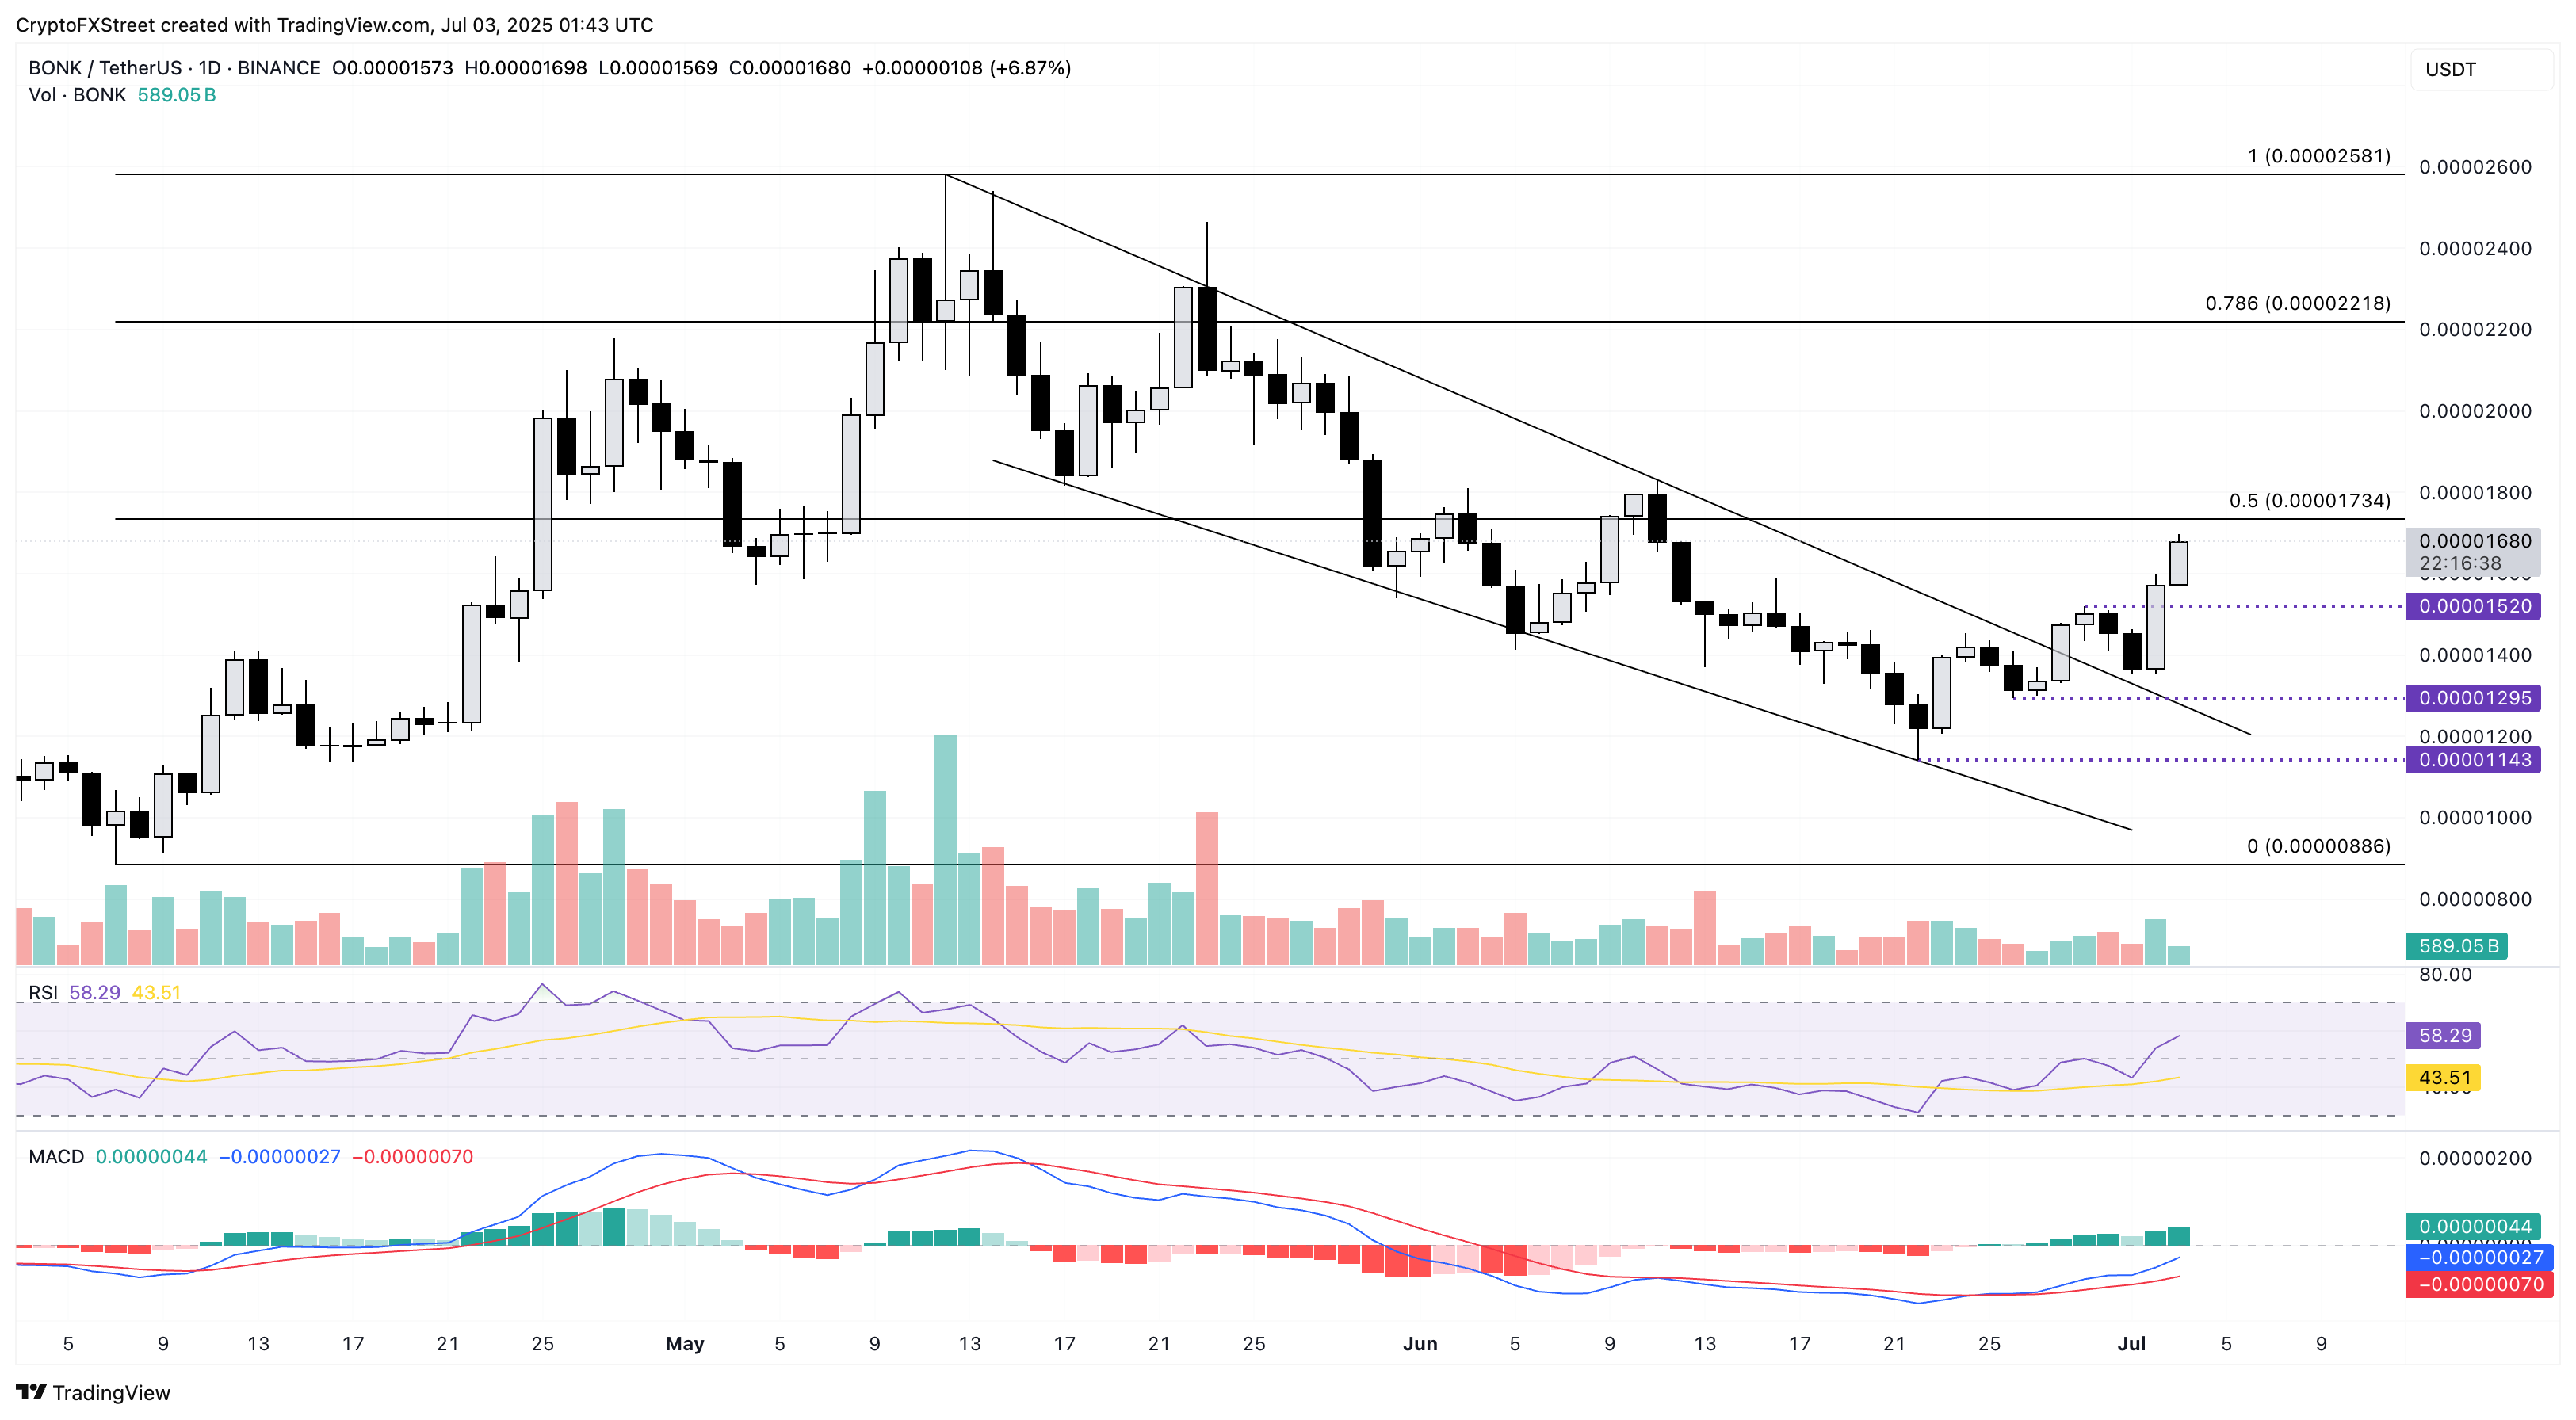
BONK/USDT daily price chart.
However, a reversal from the 50% Fibonacci level could test the June 29 high of $0.00001520.
Celestia breaks above the descending channel
Celestia trades in the green by over 2% at the time of writing on Thursday, extending the 16% from Wednesday. The uptrend breaks out of a falling channel, fueled by the underlying RSI divergence, as previously reported by FXStreet.
As TIA signals a potential trend reversal, a clean push above the June 24 high at $1.68 could extend the recovery to the 50% Fibonacci level at $2.35, traced from the high of May 14 at $3.40 to the low of June 22 at $1.31.
The indicators reflect a gradual shift as RSI at 45 nears the halfway line after bouncing off the oversold region. Meanwhile, the MACD and its signal line are DEEP in the negative region despite the growth of green histogram bars.
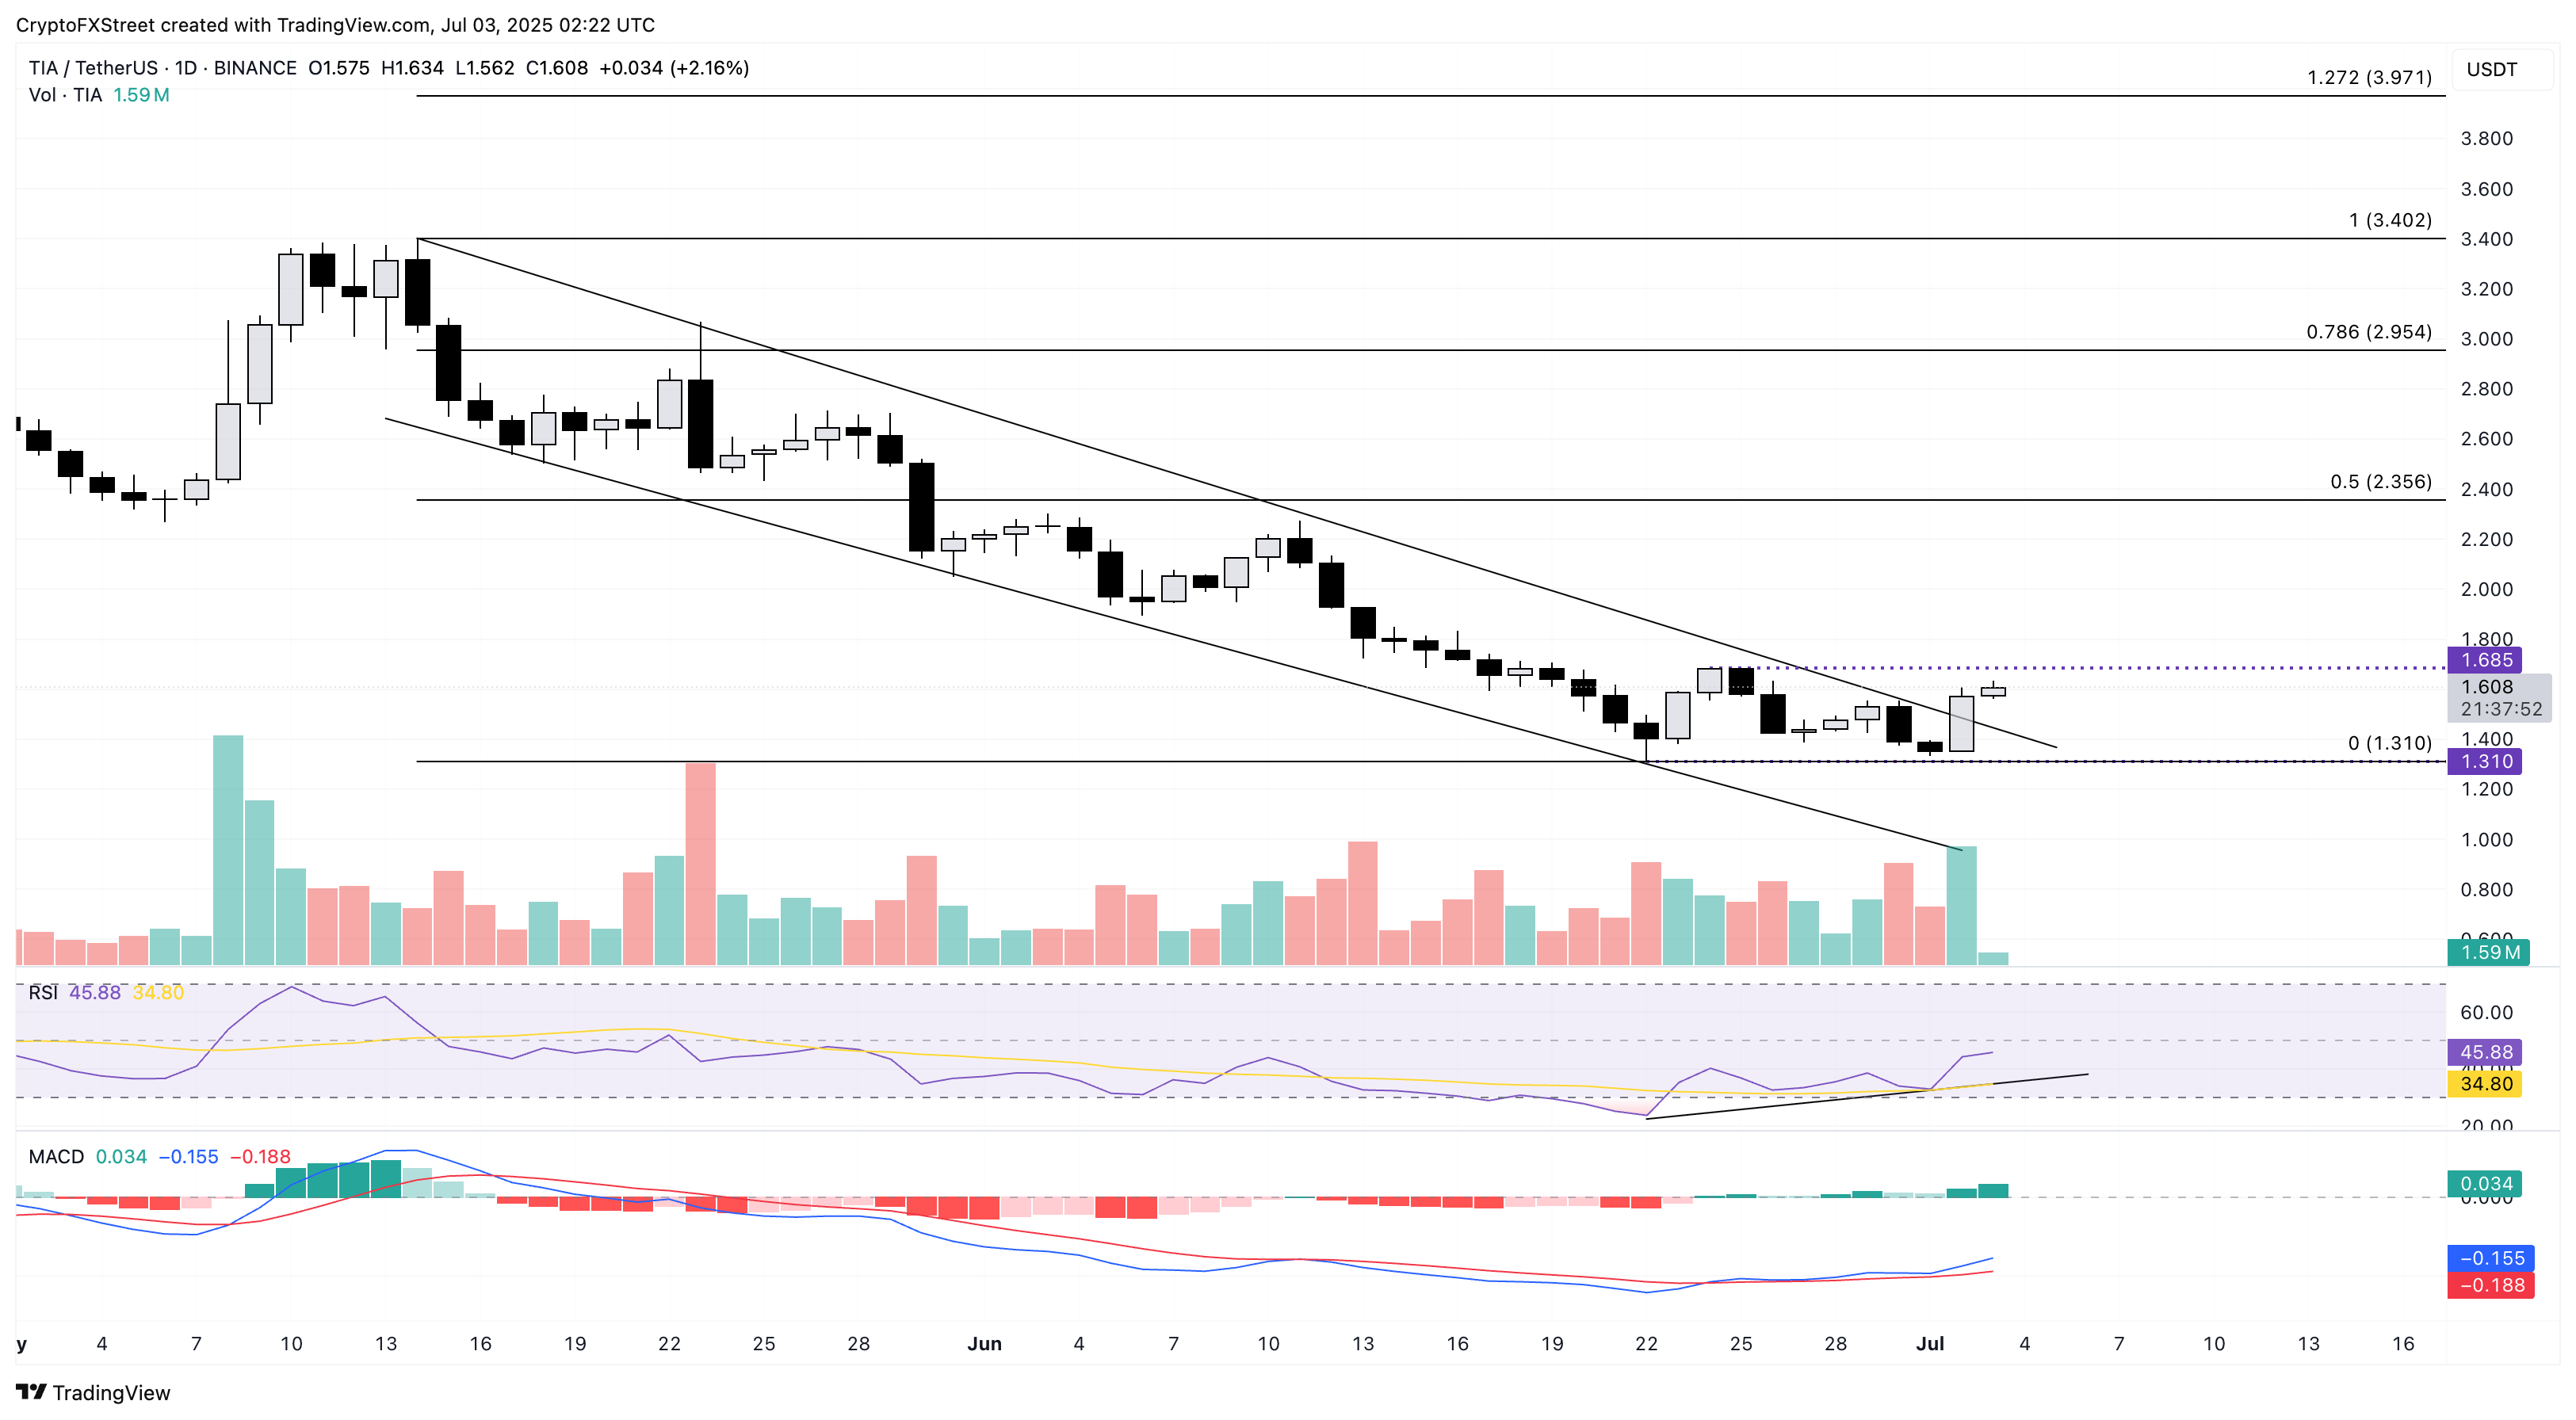
TIA/USDT daily price chart.
If TIA fails to exceed the $1.68 level, a reversal could test the $1.31 base level.
WIF eyes channel breakout to extend gains
Dogwifhat ticks higher by over 2% at press time on Thursday, adding to the 16% gains from the previous day. WIF nears a key resistance trendline formed by connecting the highs of May 12, May 29, and July 2.
A daily close above the resistance trendline near Wednesday’s high of $0.934 WOULD mark the breakout of a falling channel completed by a parallel support trendline formed by the lows of May 15 and June 1. The breakout rally could target the highest trading price of June at $1.078.
The technical indicators suggest a minor surge in recovery momentum, as the RSI remains above the halfway line at 56, indicating room for growth. Meanwhile, the MACD indicator displays the MACD and signal lines inching closer to crossing the zero line.
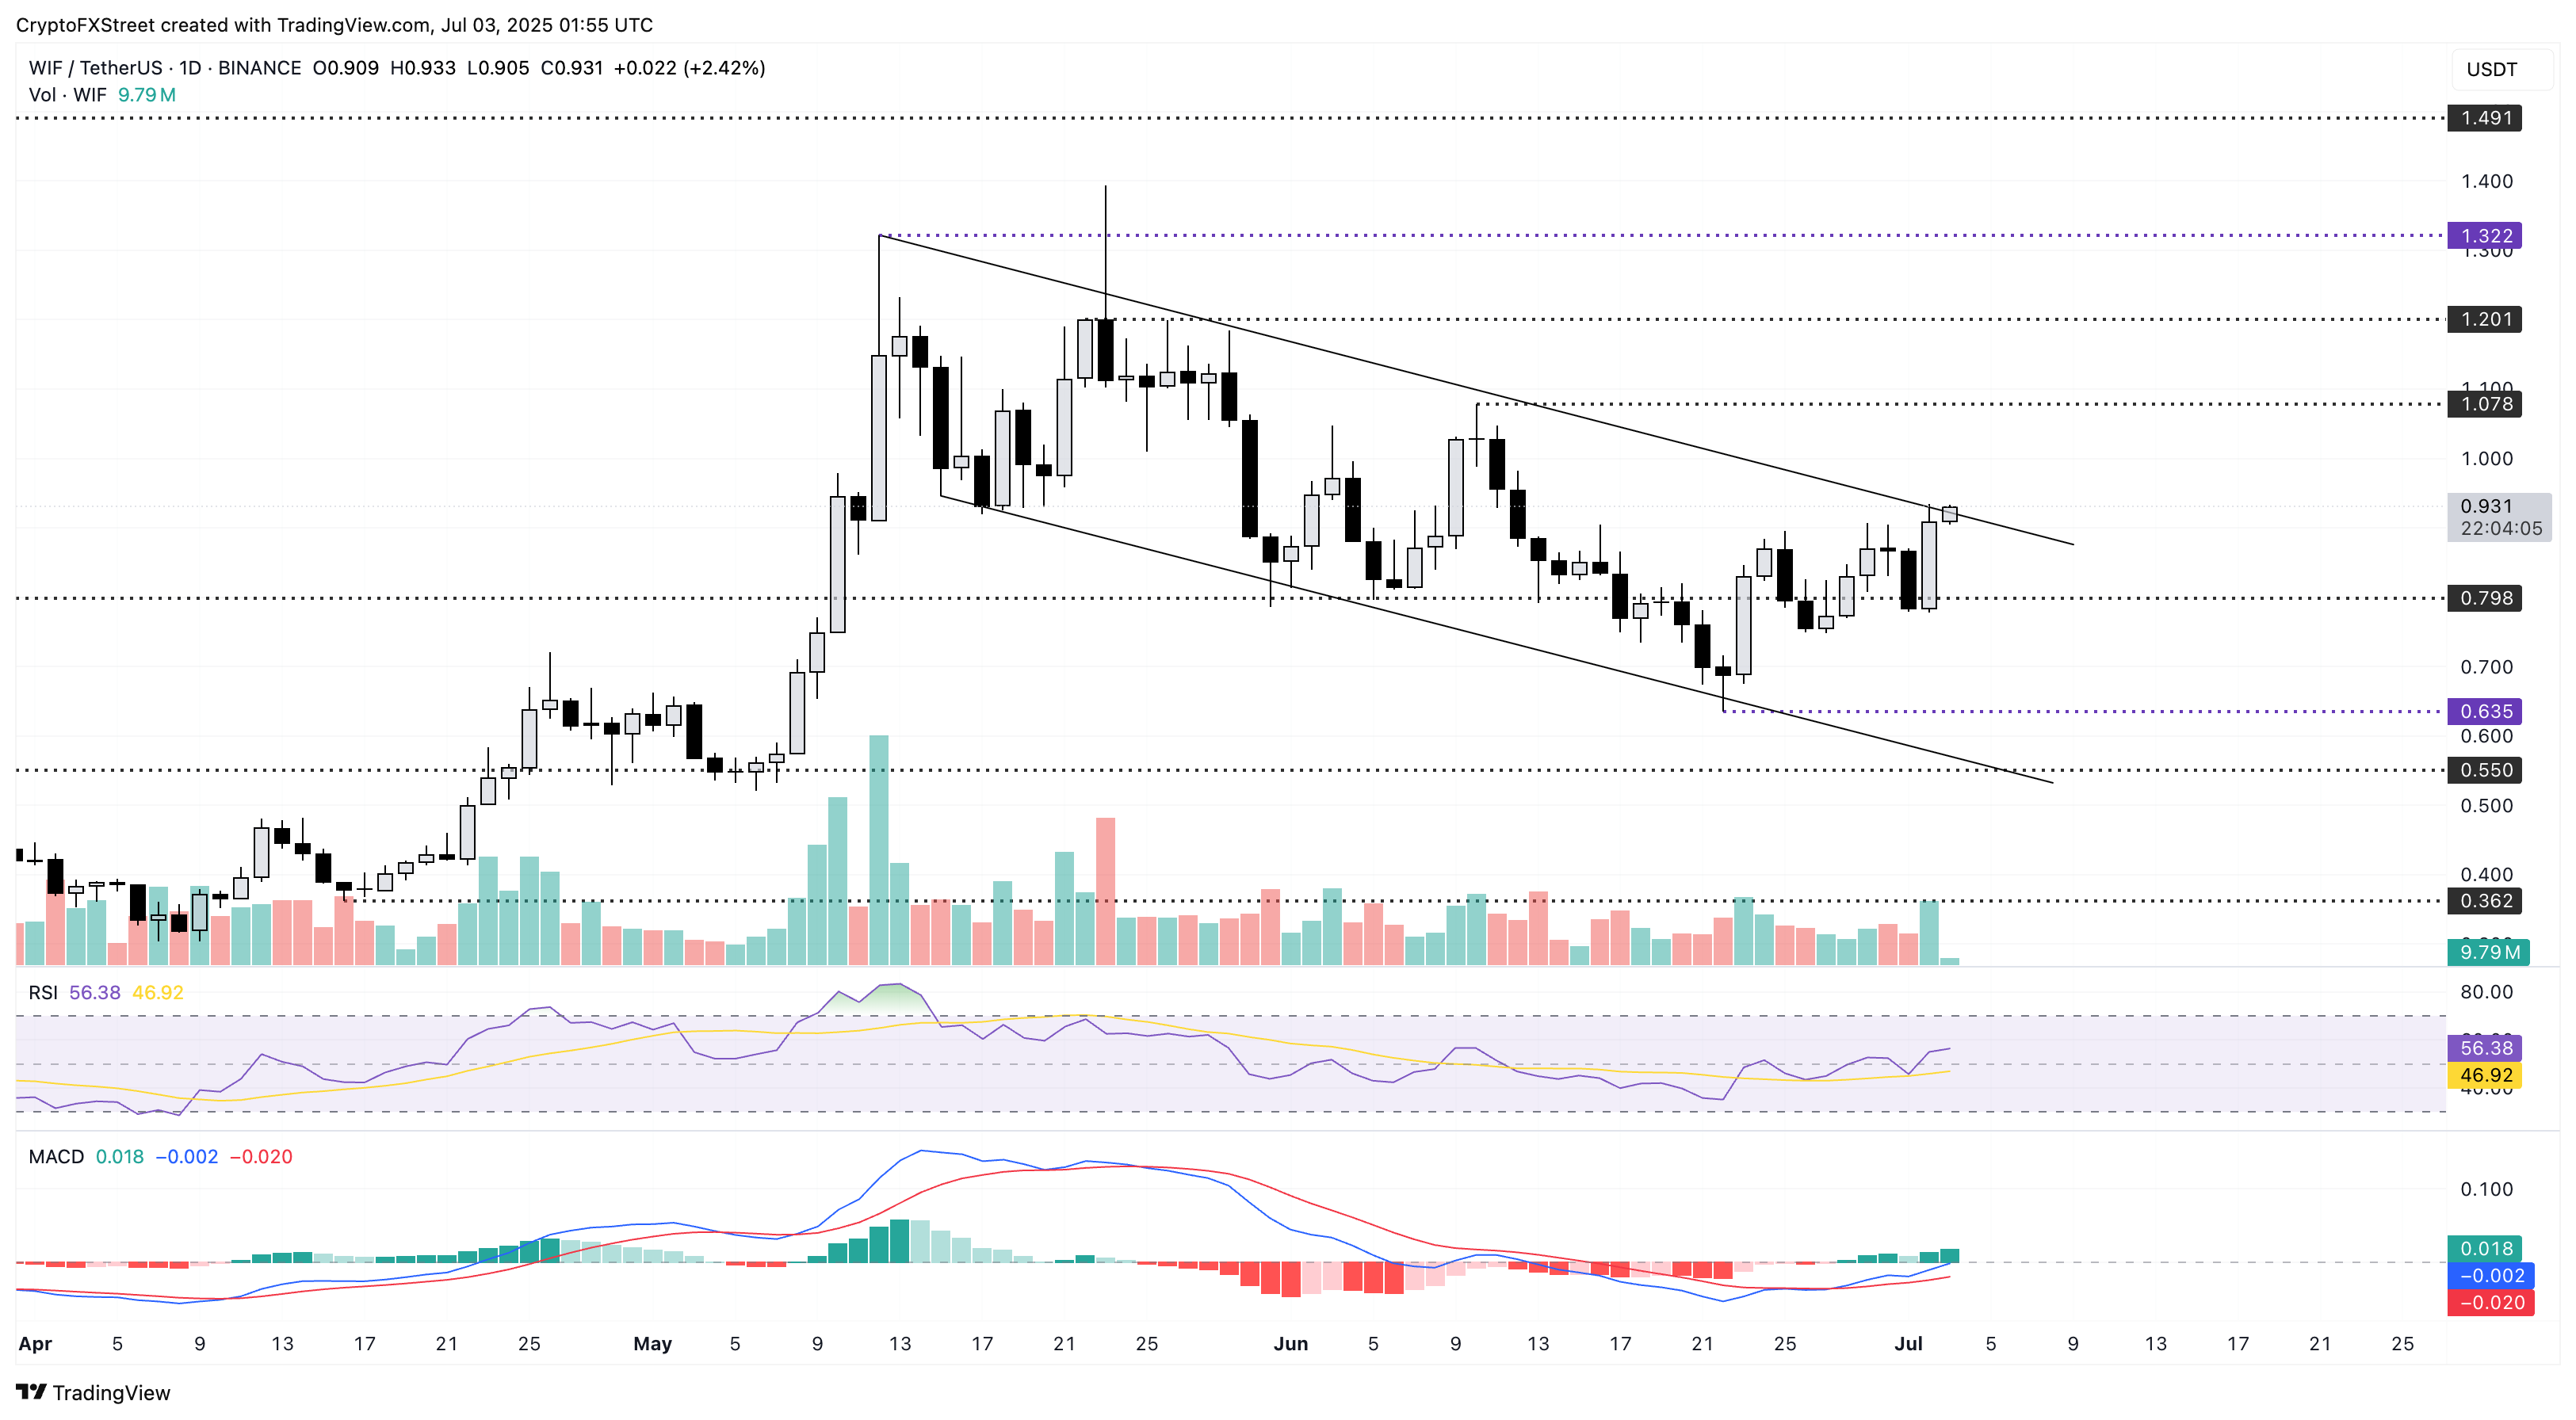
WIF/USDT daily price chart.
On the contrary, a reversal within the channel could test the $0.798 support level, last successfully tested on June 13.
