Bitcoin Rockets Past $110K — Is This the Breakout That Sticks?

Bitcoin's bull run just hit ludicrous speed—flirting with $110K like a hedge fund manager at a yacht party. But can it sustain the altitude, or are we watching another speculative parabola waiting to snap?
The $110K psychological barrier
Traders are sweating over order books as BTC teases its all-time high. The last resistance before uncharted territory smells like burnt leverage and institutional FOMO.
Liquidity or lunacy?
Market depth looks thinner than a central banker's excuses during inflation spikes. If this rally holds, even goldbugs might start swapping their ingots for hardware wallets.
One thing's certain—Wall Street's still trying to short this rocket with paper hands while the crypto natives strap in for the next leg up. Whether it's sustainable growth or just another liquidity mirage remains to be seen (but hey, at least it's more entertaining than watching bond yields).
Bitcoin Price Regains Traction
Bitcoin price remained supported above the $105,000 level and started a fresh increase. BTC cleared many hurdles NEAR $106,200 to start a decent increase.
There was a break above a bearish trend line with resistance at $106,300 on the hourly chart of the BTC/USD pair. The pair pumped above the $107,500 resistance level. It cleared the 76.4% Fib retracement level of the downward MOVE from the $108,792 swing high to the $105,116 low.
Finally, the price surged toward the $110,000 level. It tested the 1.236 Fib extension level of the downward move from the $108,792 swing high to the $105,116 low.
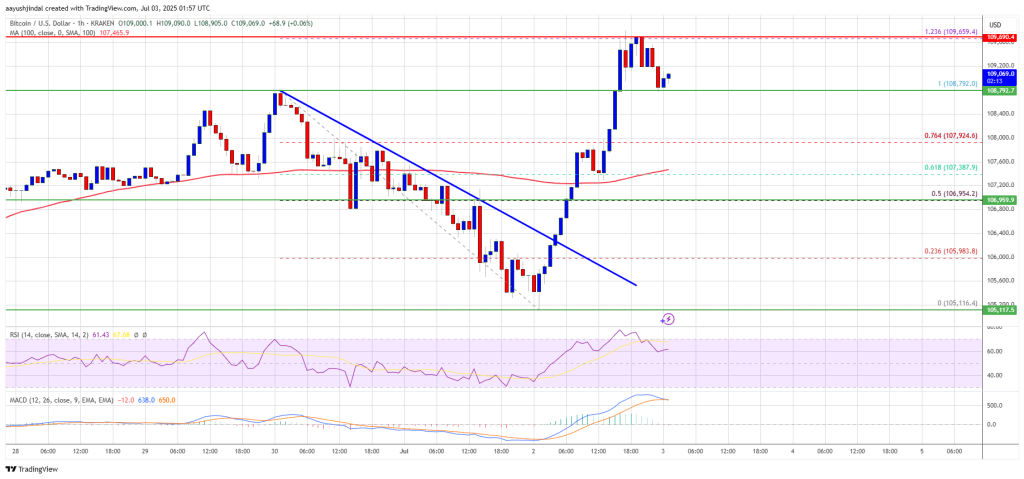
Bitcoin is now trading above $108,000 and the 100 hourly Simple moving average. On the upside, immediate resistance is near the $109,400 level. The first key resistance is near the $110,000 level. A close above the $110,000 resistance might send the price further higher. In the stated case, the price could rise and test the $112,000 resistance level. Any more gains might send the price toward the $113,200 level.
Downside Correction In BTC?
If Bitcoin fails to rise above the $110,000 resistance zone, it could start another decline. Immediate support is near the $108,750 level. The first major support is near the $108,000 level.
The next support is now near the $107,200 zone. Any more losses might send the price toward the $106,500 support in the near term. The main support sits at $105,000, below which BTC might continue to move down.
Technical indicators:
Hourly MACD – The MACD is now losing pace in the bullish zone.
Hourly RSI (Relative Strength Index) – The RSI for BTC/USD is now above the 50 level.
Major Support Levels – $108,000, followed by $107,200.
Major Resistance Levels – $110,000 and $112,000.
