Bitcoin Bloodbath: Is This 3% Drop Just the Beginning of BTC’s Pain?

Bitcoin bulls got sucker-punched today as BTC bled out another 3%—and the charts whisper this might be chapter one of a horror story.
Technical breakdown: The king of crypto can't catch a bid. Every minor rally gets smothered like a meme coin in a bear market. Key support levels? More like suggestions at this point.
Market psychology watch: Traders are eyeing those order books like Wall Street bankers eyeing a bailout. Liquidity's thinner than the excuses from crypto projects that missed their roadmap targets.
The cynical take: Maybe Bitcoin's just taking notes from traditional finance—where 'temporary corrections' magically turn into decade-long slumps. But hey, at least in crypto, the crashes come with free memes.
Technical Analysis
By ShayanMarkets
The Daily Chart
After an extended period of sideways movement within the $116K to $123K range, Bitcoin has now turned downward, breaching the lower threshold. This drop signals a rise in distribution and selling interest, with the asset now testing a major support near $114K, coinciding with the lower boundary of its long-standing price channel.
This region marks a critical battleground between buyers and sellers. A break below this level WOULD likely trigger a new wave of sell orders, setting the stage for a deeper correction toward the $111K zone. The reaction at this pivotal level is expected to play a key role in shaping Bitcoin’s mid-term trajectory.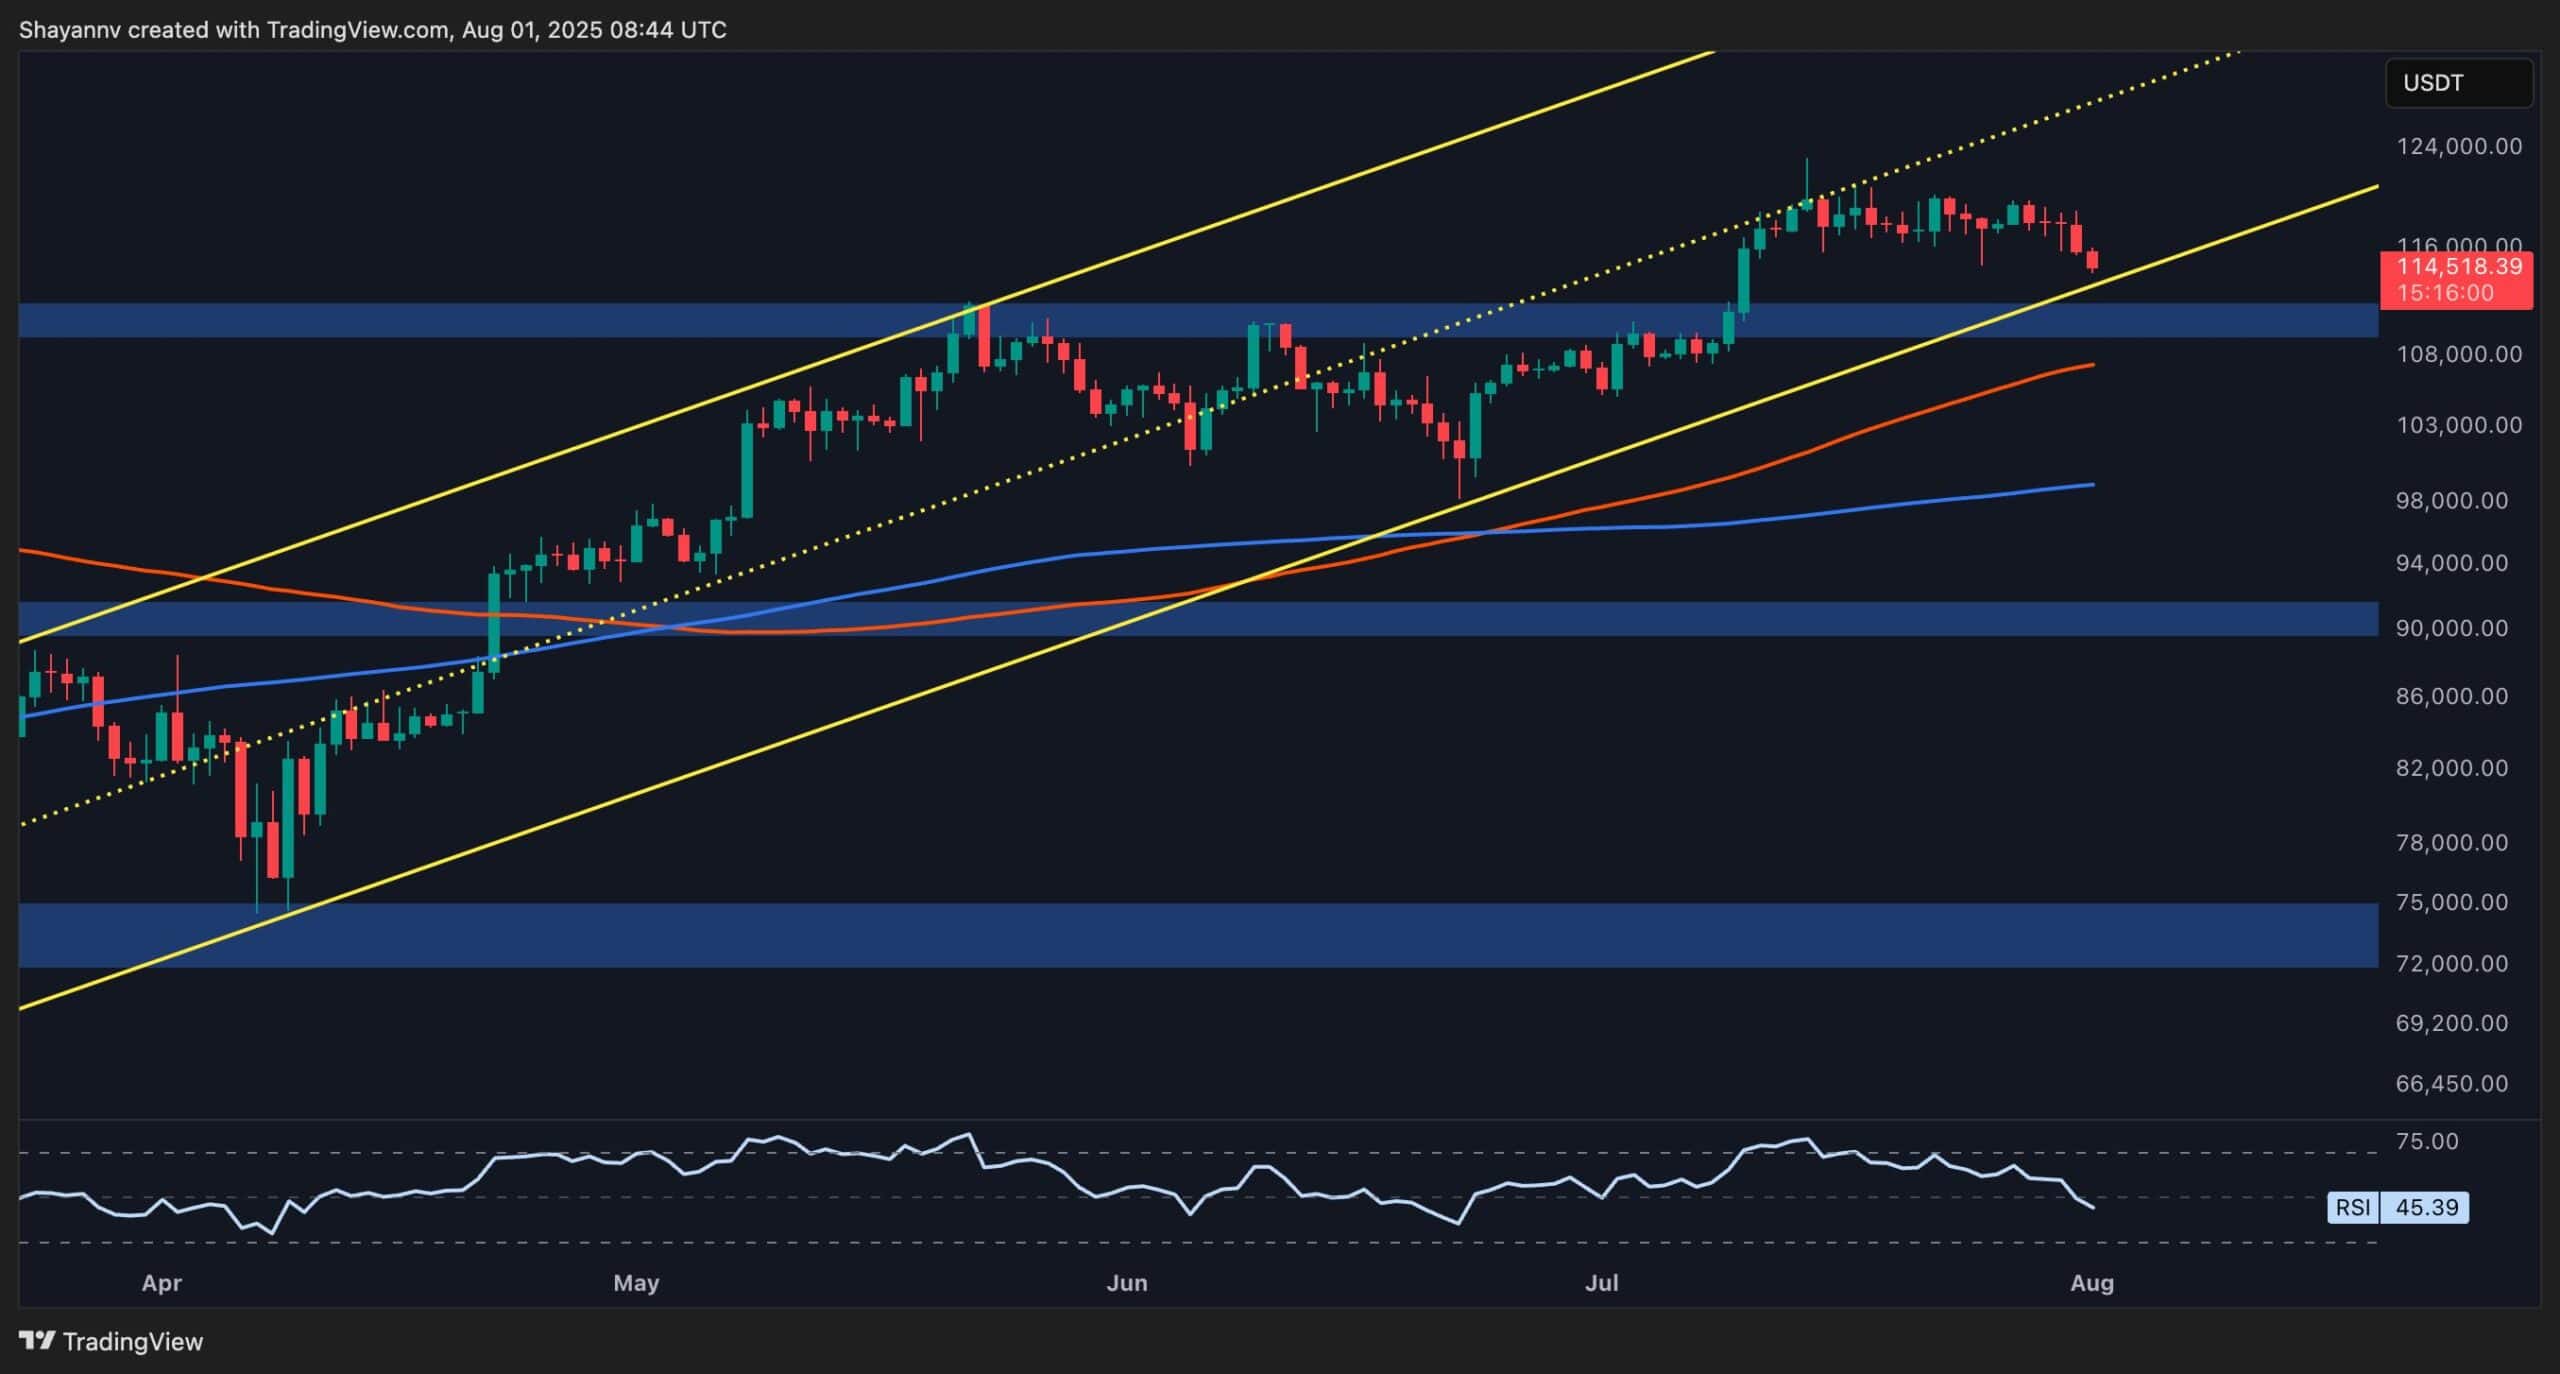
The 4-Hour Chart
Zooming in, the price was recently rejected from the upper boundary of a rising flag near $118K, signaling strong selling pressure. The recent drop has taken bitcoin back toward the lower end of the flag structure, around $114K, which also aligns with the 0.5 Fibonacci retracement level.
This confluence creates a strong area of support. A confirmed break below this level could lead to a long-squeeze scenario, pushing the price even lower. However, if demand picks up and buyers regain control, a bounce toward the $118K zone remains possible in the short term.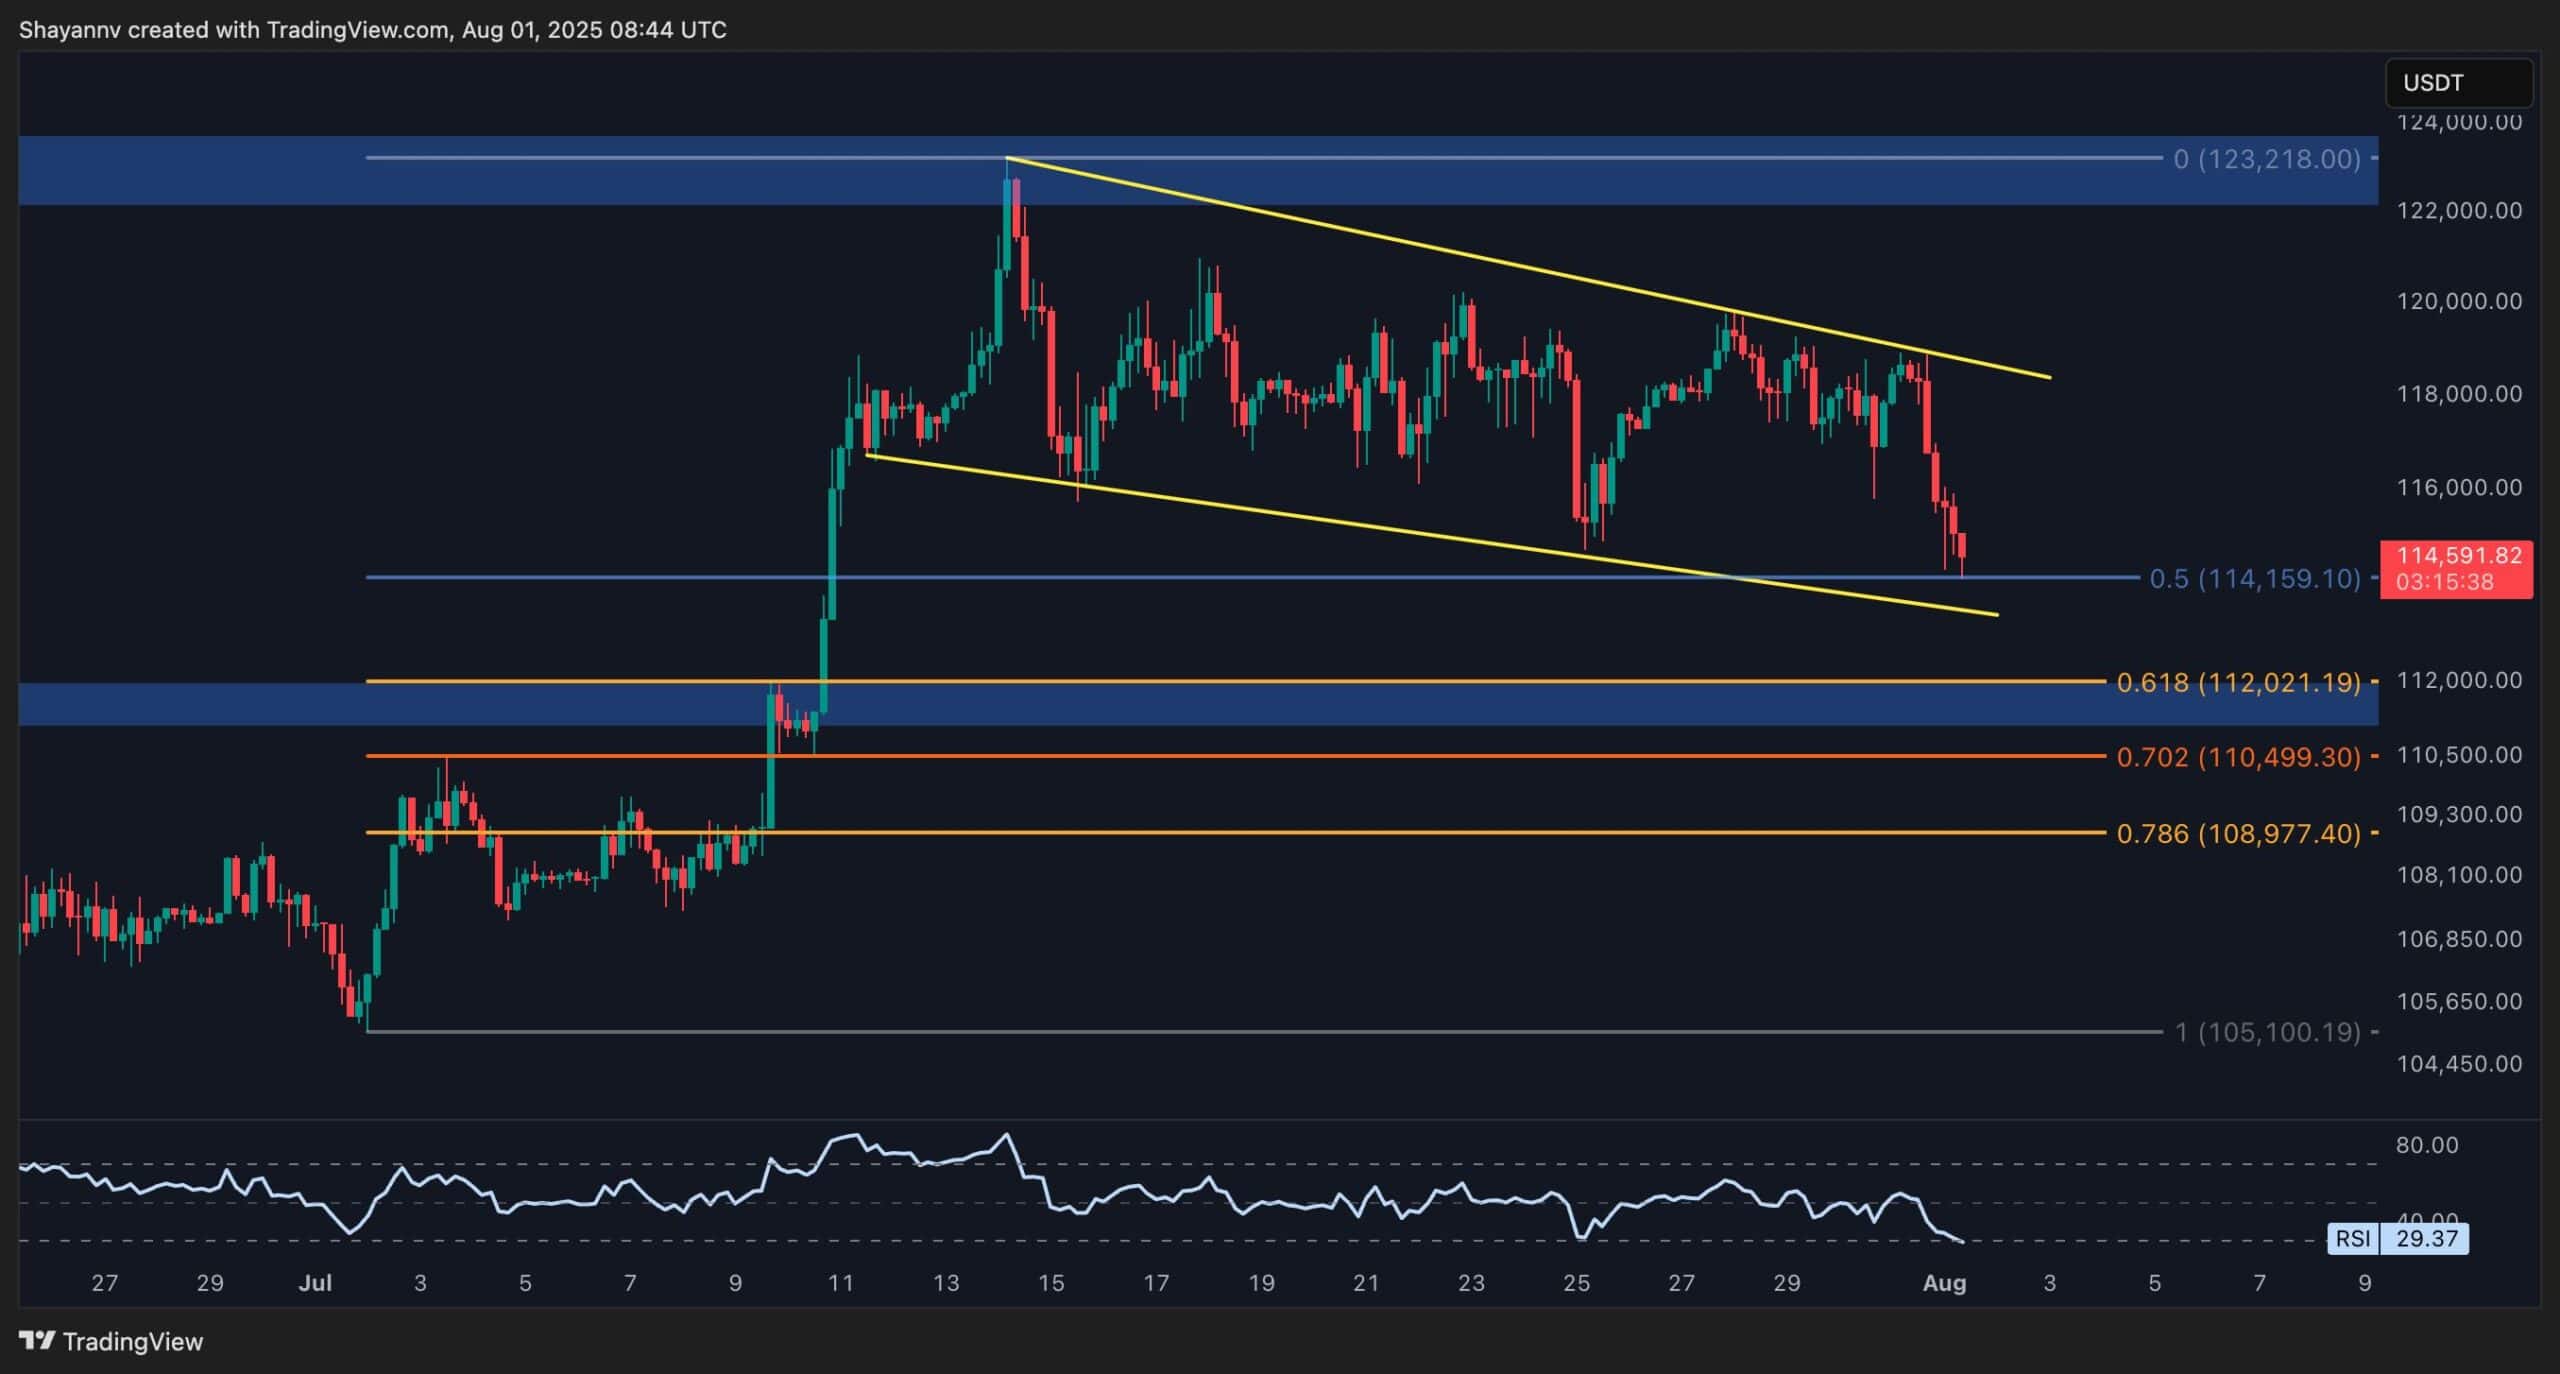
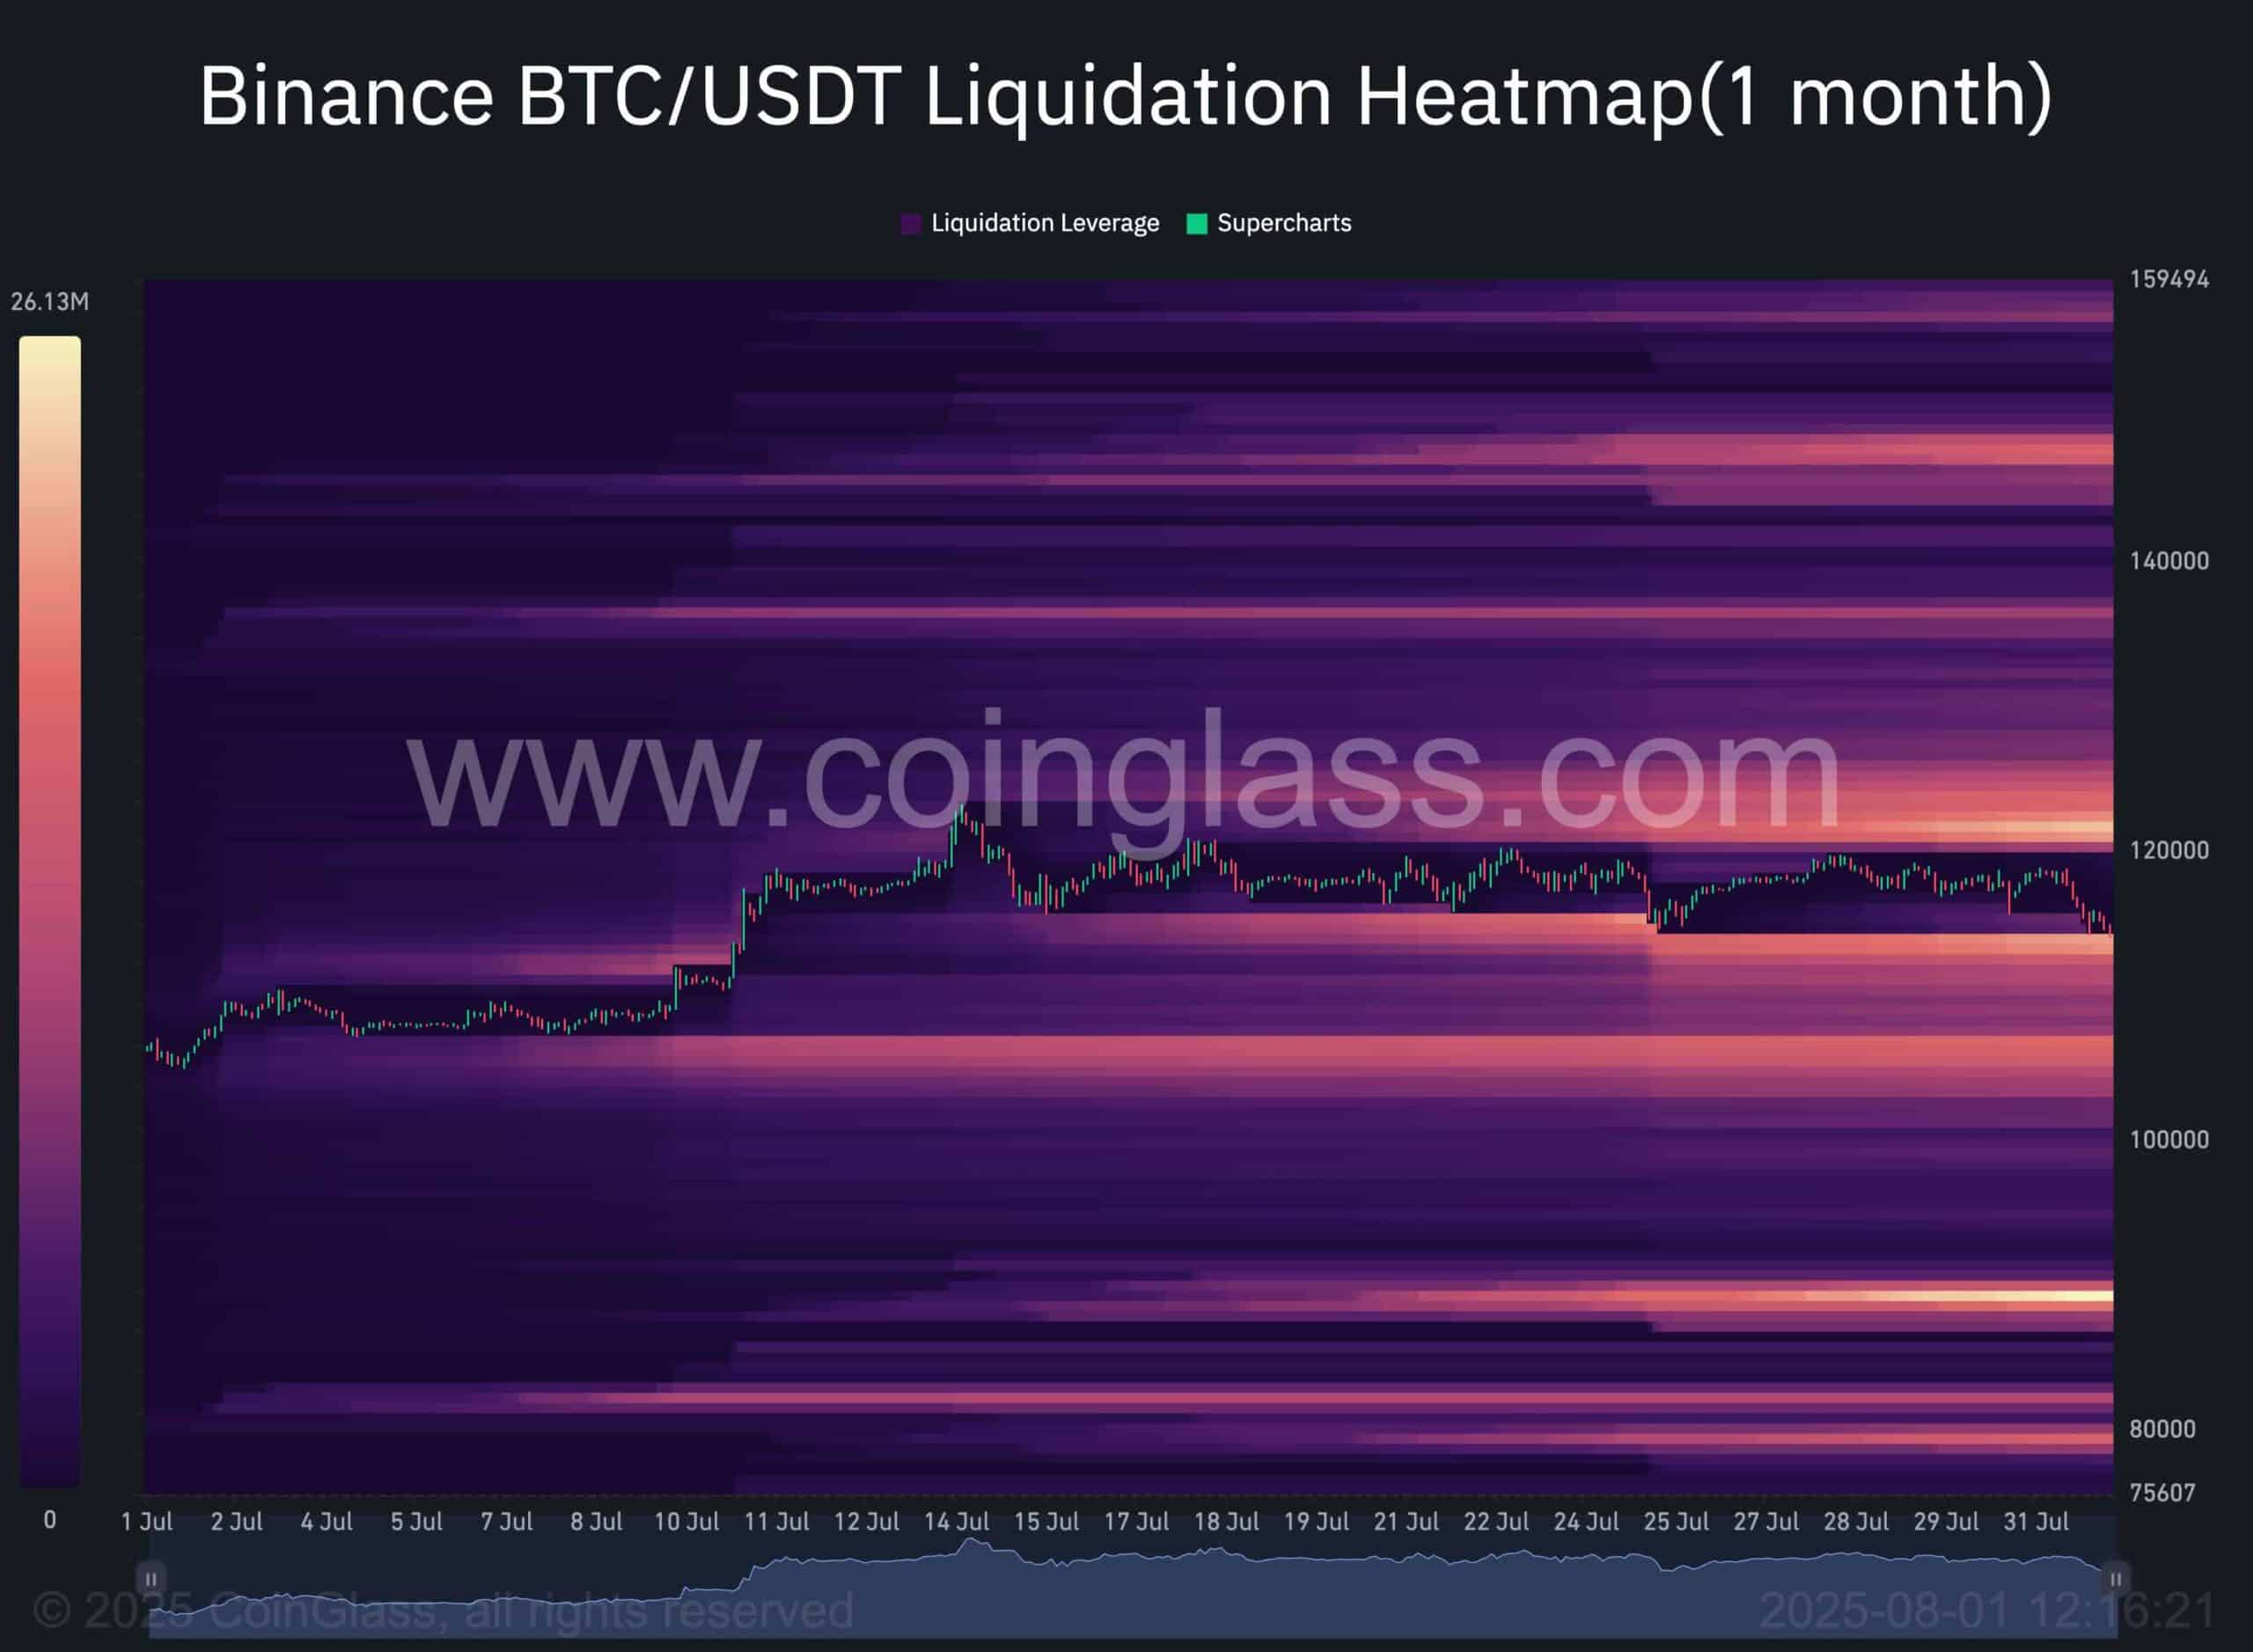
On-chain Analysis
By ShayanMarkets
The Binance BTC/USDT liquidation heatmap highlights a tense standoff within the current market structure, with Bitcoin’s price caught between two significant liquidity pockets, one concentrated above the $120K level and another below $114K. These zones mark areas of high Leveraged exposure, making them key magnets for institutional players and liquidity-driven moves.
As the price hovers NEAR the $114K threshold, the probability of a downward breakout increases. A drop below this level could trigger a chain reaction of stop-outs and liquidations, driving sharp downside momentum. Traders should monitor these zones closely, as any decisive move could unleash rapid and volatile price swings.