Bitcoin’s High-Stakes March: The $120K Forecasts Collide with the $60K–$70K Accumulation Grind

Bitcoin's price action is a classic tug-of-war between speculative frenzy and institutional patience. On one side, analysts project a parabolic surge toward $120,000, painting visions of a new financial paradigm. On the other, the market grinds through a stubborn $60,000 to $70,000 range—a zone where smart money accumulates assets while retail investors check their portfolios every five minutes.
The Accumulation Game
This isn't volatility; it's a calculated consolidation. Major players aren't spooked by the sideways action—they're loading up. The $60K-$70K band has become a strategic buying floor, where long-term conviction meets short-term uncertainty. Every dip gets scooped, creating a formidable support level that makes a catastrophic crash increasingly unlikely. It's the financial equivalent of watching whales feed.
Forecast Frenzy vs. On-Chain Reality
Meanwhile, the $120K forecasts keep coming, fueled by halving cycles, ETF inflows, and macro-economic narratives. The bullish case is structurally sound, but it's running headfirst into the market's current appetite for gradual gains over explosive rallies. The data shows accumulation, not distribution—suggesting this consolidation is preparation, not capitulation.
March's make-or-break momentum hinges on whether bullish catalysts can overpower this accumulation gravity. Will we see a clean breakout, or more time in the grinding channel? One thing's certain: the traders accumulating now will likely be laughing all the way to the bank—or at least to their next over-leveraged margin call. Because in crypto, even the smart money occasionally forgets that trees don't grow to the sky.
Bitcoin ETF Inflows Point to $110K–$120K: But Can It Last?
Despite the recent chop, the institutional thesis remains aggressively bullish. Macro economist Henrik Zeberg has doubled down on a Bitcoin price prediction that sees the asset nearly doubling within weeks.
Portfolio Target Analysis – March 2026
Fundamental Perspectives to the Outlook and Targets of the Portfolio.
My Core Hypothesis
Bitcoin rallies to $110–120K in the primary scenario – fueled by Risk-On Fever, ETF inflows, and continued institutional adoption. There is a…
On March 1, Zeberg outlined a “primary scenario” targeting $110,000 to $120,000, representing an 80% upside from the recent lows around $66,000.
Bitcoin rallies to $110–120K in the primary scenario – fueled by Risk-On Fever, ETF inflows, and continued institutional adoption.
— Henrik Zeberg (@HenrikZeberg) March 1, 2026
Zeberg attributes this potential surge to “Risk-On Fever” and relentless ETF demand. He even assigns a 25% probability to an overshoot scenario reaching $140,000 to $150,000.
This aligns with data from Bernstein analysts led by Gautam Chhugani, who argue that the market is witnessing the “weakest bear case” in history due to banking adoption and pro-crypto policies under the TRUMP administration.
Institutional infrastructure is rapidly catching up to these forecasts. For instance, Morgan Stanley applying for a national trust charter to hold clients’ crypto signals that major players are positioning for a long-term hold, reducing the floating supply available on exchanges.
If these inflows sustain their current pace, the supply shock could validate Zeberg’s $120,000 target sooner than the derivatives market expects.
Bitcoin $62.9K Short Squeeze, and Why March is Critical
The path to these highs, however, is being paved with volatility. Bitcoin dropped to $62,920 early last week on Feb 24. The dip punctured the rising support line, trapping late bears who piled in expecting a crash to $50,000.
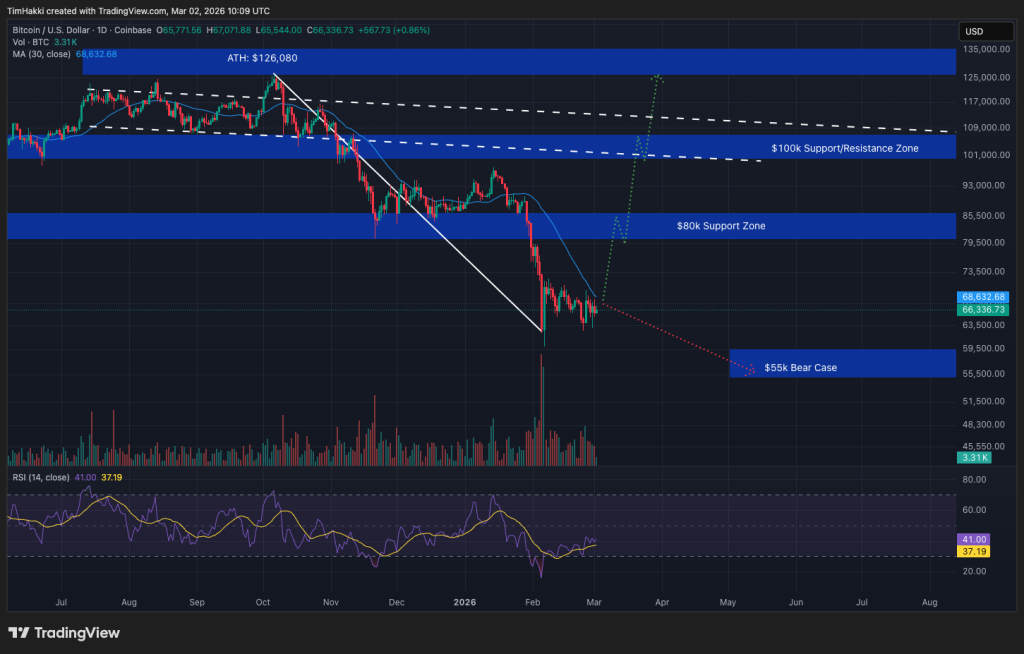
What followed was a textbook BTC short squeeze. As price reclaimed $65,000, short positions were forced to cover, driving the asset back up above $69,000 the following day.
This flush mirrors the market dynamics seen recently, where Bitcoin rebounded after sudden geopolitical shocks erased $5K in 24 hours, proving the market’s resilience at these levels.
The RSI on the daily chart has reset from overbought territory to a neutral 41, suggesting the market has room to run if buying pressure returns.
Is Bitcoin’s March to $120k Possible?
CoinMarketCap’s Fear & Greed Index is currently set to “Extreme Fear” (15/100), a classic contrarian signal that often marks local bottoms.
The divergence is clear: weak hands are selling the dip, while smart money treats the $60K floor as a gift. Key historic patterns suggest that post-halving corrections often end with this type of grinding consolidation before the markup phase resumes.
The market is now coiled between two critical levels. The immediate resistance sits at $72,000. A clean break above this level confirms the end of the correction and opens the door to Zeberg’s $110,000 target.
However, risks remain. If Bitcoin fails to hold the $60,000 support, the structure weakens significantly. Bearish voices like Jimmy Wales have famously argued against the asset’s long-term viability, and warnings that BTC could collapse below $10k should investors panic still circulate during downturns, though they look increasingly disconnected from the current institutional reality.
Still, the odds may yet favor the bulls. The combination of political tailwinds from the expected passing of CLARITY, ETF inflows, and a completed leverage flush sets the stage for a march higher.
