Shiba Inu Defies 8% Drop—Still on Track for Monthly Gains

Shiba Inu claws back from red—proving memecoins laugh at 'rational markets.'
Blood in the streets? Not for SHIB holders. Despite an 8% haircut this week, the dog-themed token flips analysts the paw—still green for July. When your 'fundamentals' are Elon tweets and Kabosu memes, who needs balance sheets anyway?
Key moves: Whale accumulation spikes as retail panics (classic). RSI hovering near oversold—just in time for the next hype cycle. Exchange reserves thinning like a DeFi founder's hairline.
Bottom line: In crypto, 'irrational exuberance' is just another Tuesday. SHIB's 30-day chart? A Rorschach test for degenerates. Either you see a bullish flag... or the SEC's next lawsuit.
Key AI insights
- SHIB plunges 2.28% from $0.000013107 to $0.000012809 during a 24-hour window ending July 30, 14:00
- The burn mechanism destroyed 600 million tokens in a single session, marking a 16,710% surge in destruction rate
- Competitors BONK, PENGU, and utility-driven Remittix capture trader flows as SHIB loses meme coin leadership.
Technical Levels
- Price dropped 2.28% from $0.000013107 to $0.000012809 across the 24-hour period.
- Trading bandwidth spans $0.0000005215, equivalent to 4.12% of the total range.
- Resistance capped advances at $0.000013184 with rejection during the 17:00 session.
- Support emerged at $0.000012663, backed by 1.25 trillion token volume.
- The downtrend intensified after 10:00 on July 30, with consecutive lower peaks.
- Late-session bounce delivered a 0.25% gain in the final trading hour.
- The volume explosion reached 43.5 billion tokens during the 13:57-13:59 rally phase.
- The three-wave pattern emerged: consolidation, distribution, then short-covering.
Bullish hints
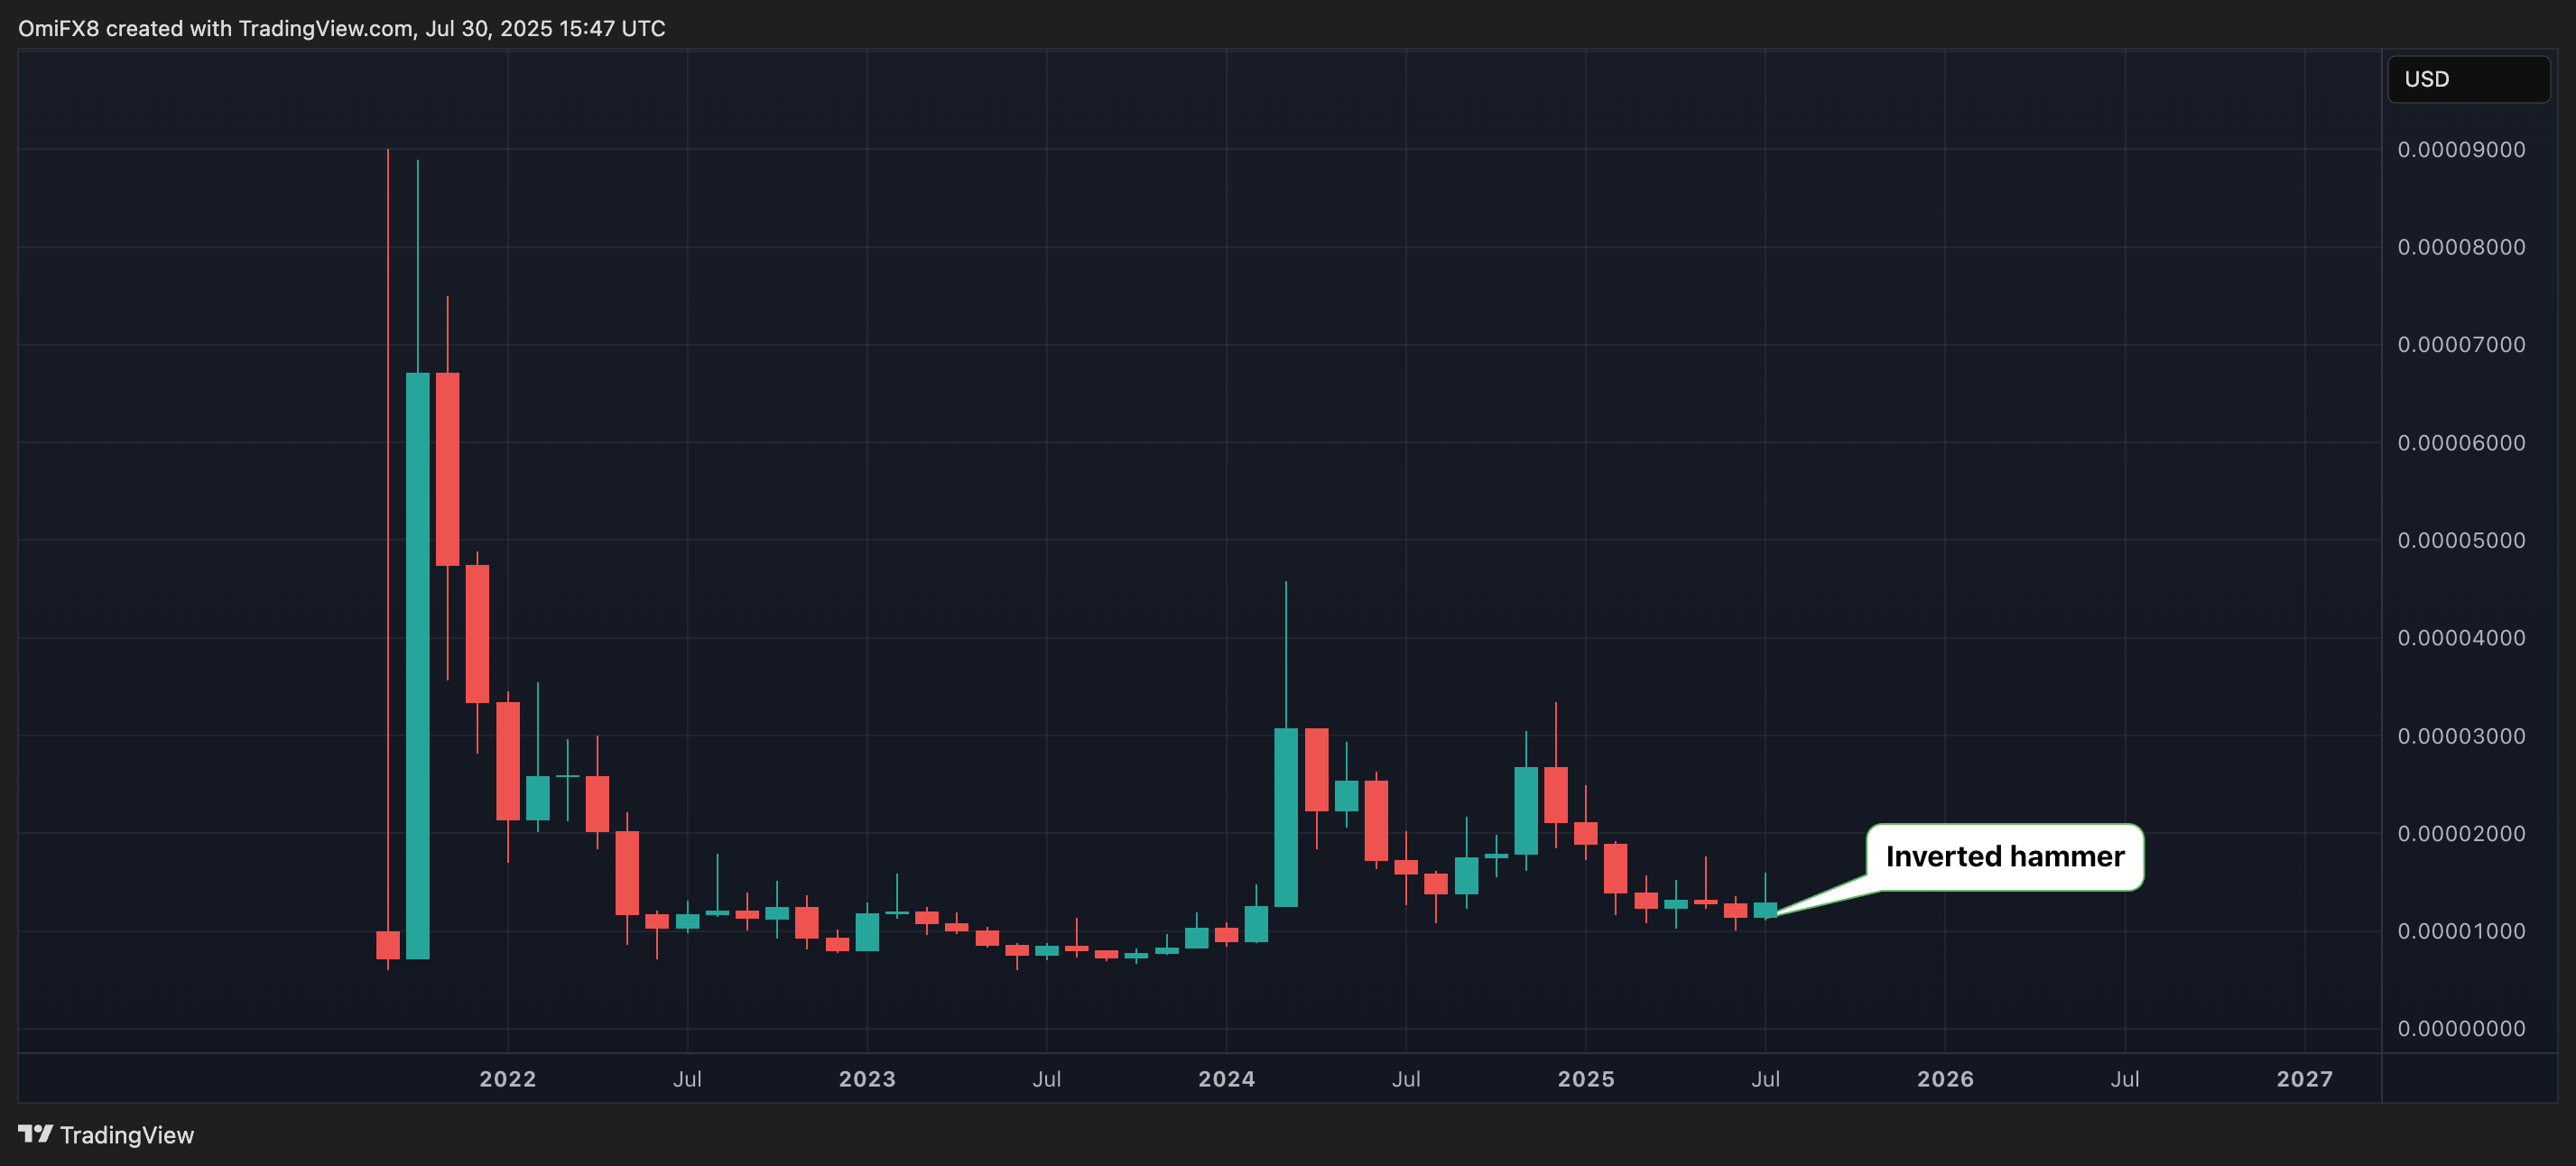
SHIB's monthly price chart shows the token is likely to end July with an inverted hammer candle as it looks to bounce from year-to-date lows.
An inverted hammering appearing after downtrend or at market lows indicates that buyers attempted to push the price significantly higher during the period, but sellers ultimately overpowered buyers, pushing prices back down to NEAR the opening price.
However, the sheer presence of the long upper shadow indicates that buying interest is re-emerging at these low levels, hinting at potential bullish reversal higher.