SEI Price Surge: Bullish Momentum Eyes $0.45 Breakout as Rally Accelerates

SEI's chart is printing a textbook breakout pattern—and traders are loading up for the next leg up.
Target locked: $0.45
The token's 30% weekly surge defies the broader market's sideways grind, fueled by a perfect storm of spot accumulation and perpetuals flipping bullish. Liquidity clusters suggest shorts could get steamrolled if the 4-hour candle closes above $0.38.
Meanwhile, traditional finance bros are still arguing about whether crypto is 'real'—right before FOMO-ing in at the top.

Market participants are now closely watching the $0.45 level, which has been marked as a key supply zone.
As bullish structures FORM on the 4-hour, 24-hour, and daily charts, traders are assessing whether the momentum can carry forward. At the time of writing, the daily chart shows SEI trading at $0.3494 with the price approaching the upper Bollinger Band.
Breakout Structure Forms on 4-Hour Chart
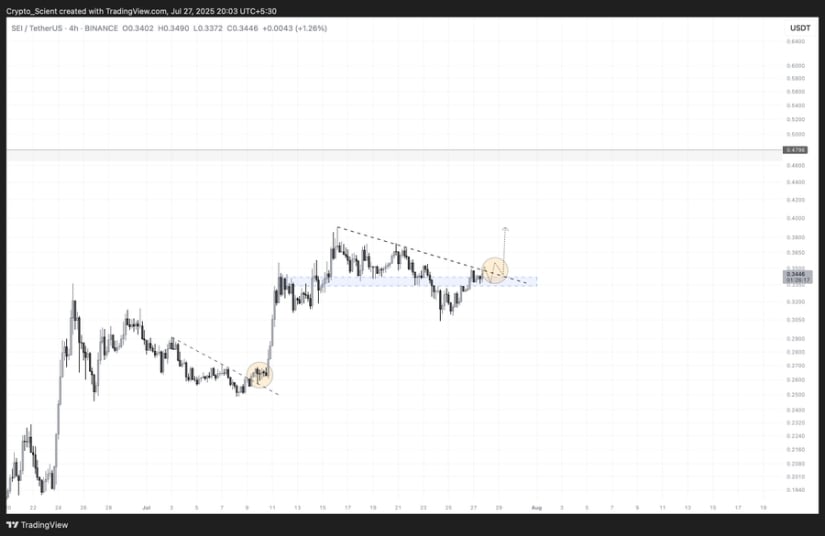
The SEI/USD T 4-hour chart, analyzed by Crypto_Scient, illustrates a breakout from a descending trendline that had capped price movement throughout July. Price action broke above this diagonal resistance and subsequently retested a horizontal support zone, shown on the chart as a light blue band between $0.325 and $0.335.
This formation, characterized by a breakout followed by a support retest, is often observed during bullish continuation phases. The reaction from this zone has so far supported the view that the trend may extend higher.
Source: X
Currently, the price is holding around $0.3446, maintaining its position above the previous resistance level that has now flipped into support. The strength of this zone adds credibility to the bullish scenario, as it aligns with the analyst’s projection toward the $0.45 resistance level.
The local market structure appears constructive, forming a sequence of higher lows that may continue to guide the trend upward. The price WOULD need to remain above $0.33 to keep this structure valid and avoid invalidation of the setup.
Intraday Momentum Supported by Volume and Trend
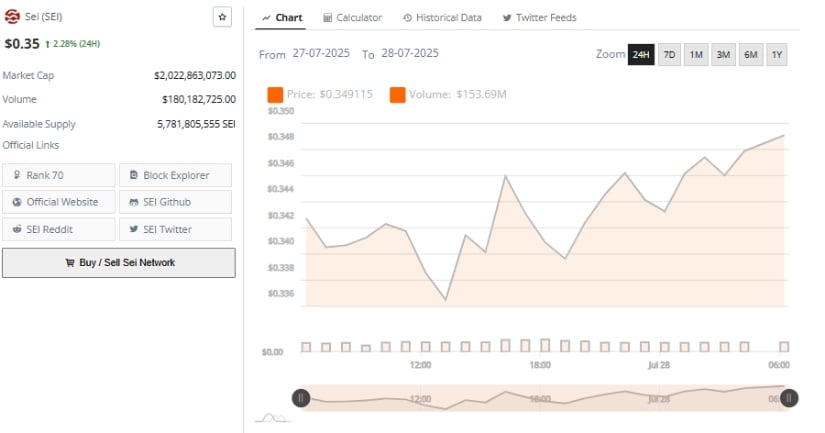
On the 24-hour chart, SEI shows steady progress, climbing from a session low of approximately $0.336 to a peak NEAR $0.35. This movement was marked by a sequence of higher highs and higher lows, reflecting consistent buying interest.
Volume data confirms that the MOVE was supported by active participation, with SEI registering $180.18 million in daily volume. This aligns with healthy accumulation patterns, as volume increased alongside price rather than during short-lived rallies.
Source: BraveNewCoin
The intraday pattern displayed a minor dip during early trading hours, followed by a swift recovery, indicating the presence of active buyers. This type of structure often precedes sustained trend continuation, particularly when backed by liquidity and stable market conditions.
The $0.345 support level now becomes critical; a hold above it could open the path to the next psychological threshold at $0.36. Overall, the volume and price action observed on the intraday chart provide additional confirmation of building momentum.
Bollinger Bands and RSI Signal Room for Extension
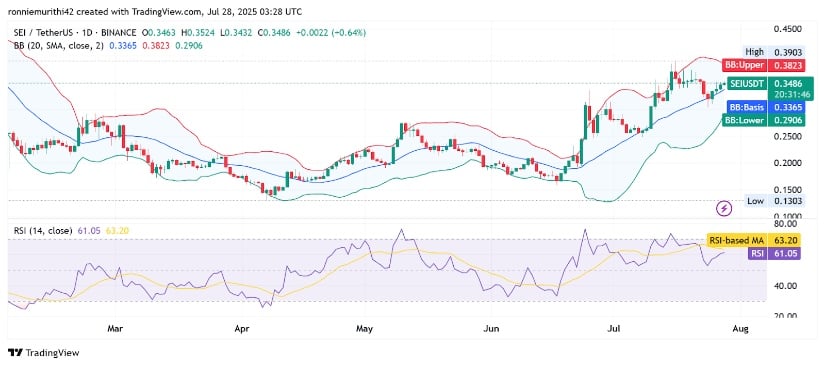
The daily chart places SEI within a potentially expanding bullish phase. Price is testing the upper Bollinger Band at $0.3824 while remaining above the basis line at $0.3365. The tightening price range near the upper band indicates controlled momentum with scope for expansion.
SEI has also respected the Bollinger midline for several sessions, suggesting dynamic support continues to hold firm. The current setup points to a scenario where a decisive break above $0.3824 could push the price toward the next resistance band between $0.39 and $0.45.
Source: TradingView
From a momentum perspective, the Relative Strength Index (RSI) reads 61.26, slightly below its RSI-based moving average of 63.22. This suggests sustained bullish strength without being overheated.
Should the RSI resume its upward path and surpass the moving average, it would confirm continued buyer dominance. However, traders may monitor the RSI for signs of divergence, which could imply short-term exhaustion. For now, Sei maintains bullish alignment, supported by both structural and momentum-based signals.
