Uniswap’s UNI Primed for Breakout: $10.10 Demand Zone Could Spark Next Leg Up

DeFi's favorite liquidity workhorse is gearing up for another run. Uniswap's UNI token shows textbook bullish reversal patterns at a critical support level—proving once again that crypto markets have the attention span of a goldfish with a Twitter addiction.
The $10.10 lifeline
Price action coils like a spring at the same demand zone where institutional buyers previously stepped in. Market makers love symmetry more than Wall Street loves bailouts.
Liquidity hunt underway
Watch for shorts to get squeezed as UNI's RSI shakes off oversold conditions. The last time these technicals lined up? A 48% rally in three weeks—because nothing says 'efficient markets' like violent 20% daily swings.
Whether this becomes DeFi's next headline act or just another fakeout depends on whether Bitcoin decides to behave. As always in crypto: hope for the best, but keep your stop-losses closer than your MetaMask password.

Recent chart action suggests the asset is in a reaccumulation phase following a pullback from local highs NEAR $10.87. Volume data and RSI indicators support a bullish continuation, but a clear signal hinges on how UNI interacts with its short-term support base.
Uniswap Price Pullback Targets High-Interest Demand Zone
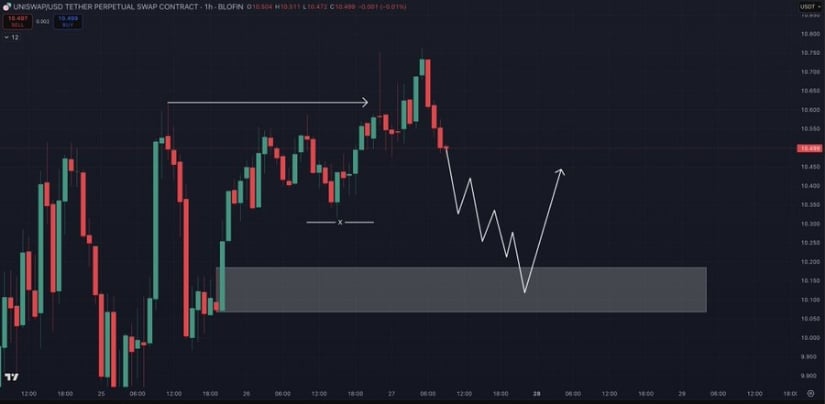
According to analyst crypto Chiefs (@cryptochiefss), the UNI/USDT 1-hour chart shows a structured retracement after peaking at $10.87. Price action has followed a descending path marked by lower highs and lower lows, moving toward a shaded grey demand zone ranging from $10.10 to $10.30. This area previously supported bullish momentum and could act as a key reversal level if defended by buyers.
Source: X
The chart illustrates a projected stair-step decline into the zone, aligning with common liquidity sweep patterns where price briefly undercuts short-term lows before bouncing. If price enters this demand area and finds support with an uptick in volume, a potential reversal toward the $10.60 level could materialize. Traders watching this structure are seeking a confirmation signal, such as bullish candlestick patterns or sustained volume increases, to validate long setups.
Bullish Volume and Price Structure Align
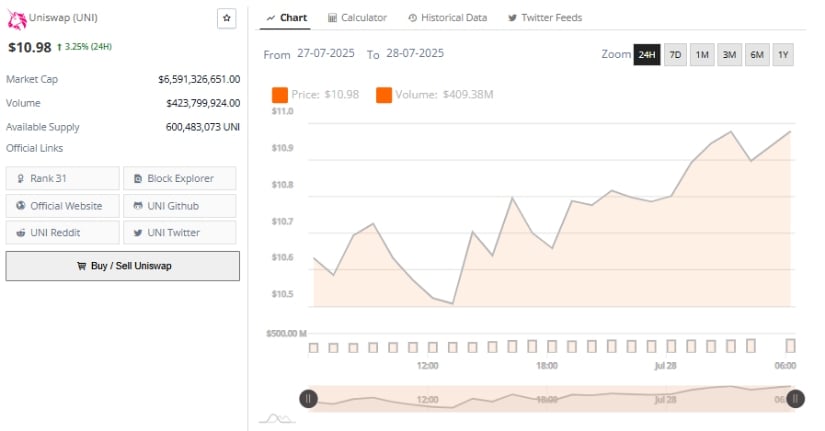
Over the past 24 hours, Uniswap has climbed 3.25%, reaching $10.98 with strong buying interest. The session opened near $10.50 and advanced steadily through a series of higher highs and higher lows, peaking just under the $11.00 psychological threshold. This consistent upward slope points to strengthening market sentiment, with momentum building incrementally.
Source: BraveNewCoin
Uniswap’s trading volume during the session reached $423.8 million, supporting the price movement with active participation. Unlike short-lived spikes, the volume remained steady during each leg of the climb, suggesting the rally was not fueled by isolated trades but by broader market accumulation. The steady FLOW of buy orders, particularly near upper price bands, indicates buyer confidence and validates the support of current price levels.
UNI’s market cap stands at $6.59 billion with a circulating supply of over 600 million tokens, contributing to DEEP liquidity. The next technical hurdle is securing a daily close above $11.00. A successful break could open pathways toward resistance levels near $11.25 and $11.60, aligned with past swing highs. However, failure to maintain momentum may invite a short-term pullback to the demand zone previously discussed.
Momentum Indicators Suggest Room for Extension
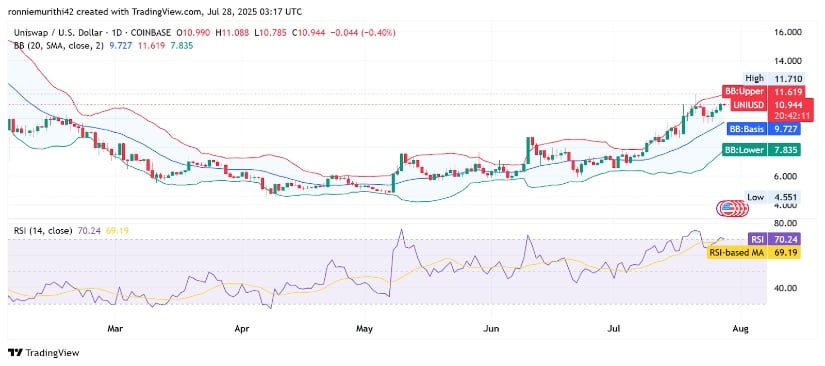
At the time of writing, Uniswap is trading at $11.014. The daily chart shows candles forming in the upper Bollinger Band range, with the upper band at $11.632 and the basis line near $9.730. This suggests bullish control remains intact, as price stays elevated within the channel. The ongoing uptrend is marked by well-defined higher highs and higher lows, and the price remains above dynamic support.
Source: TradingView
The Relative Strength Index (RSI) currently reads 71.19, slightly above the RSI-based moving average of 69.26. This positioning places UNI in mild overbought territory, often a sign of continued bullish strength rather than immediate reversal. The RSI’s alignment with upward price movement suggests healthy momentum. Traders will be observing whether RSI can climb further or diverge, which could indicate either extension or fatigue in the trend.
Immediate resistance lies at $11.71, with a break above potentially confirming a new leg upward toward $12. Conversely, a rejection from this level could bring the price back to the baseline at $9.73. The current indicators, volume structure, and price action collectively suggest a possible continuation, contingent upon buyer activity around the key support and resistance zones.
