XRP & Dogecoin Just Crashed—Did Traders Miss Their Exit? (July 2025 Update)

Meme coin mania hits a wall—again. After skyrocketing earlier this week, XRP and Dogecoin just wiped out their explosive gains in a brutal reversal. Was this a healthy correction or the start of another crypto winter?
Volatility strikes back. Both coins nosedived after failing to hold key support levels, leaving traders scrambling. Classic crypto: get rich quick dreams meet 'hold my beer' reality.
Silver lining? The dip comes amid surging institutional interest in payment-focused tokens. (Wall Street's latest 'groundbreaking discovery': digital assets might actually be useful.)
Bottom line: In crypto, the only certainty is whiplash. Smart money's already eyeing the next bounce—or quietly shorting the rebound.
XRP price: Consolidation after the surge
XRP currently trades at $3.17, showing a -2.06% change on the weekly candlestick currently in formation and a 12% drop in price over the last seven days. But what did you expect after a meteoric rise? What goes up always comes back down.
The weekly chart reveals several technical indicators worth noting for traders monitoring the coin's next moves.
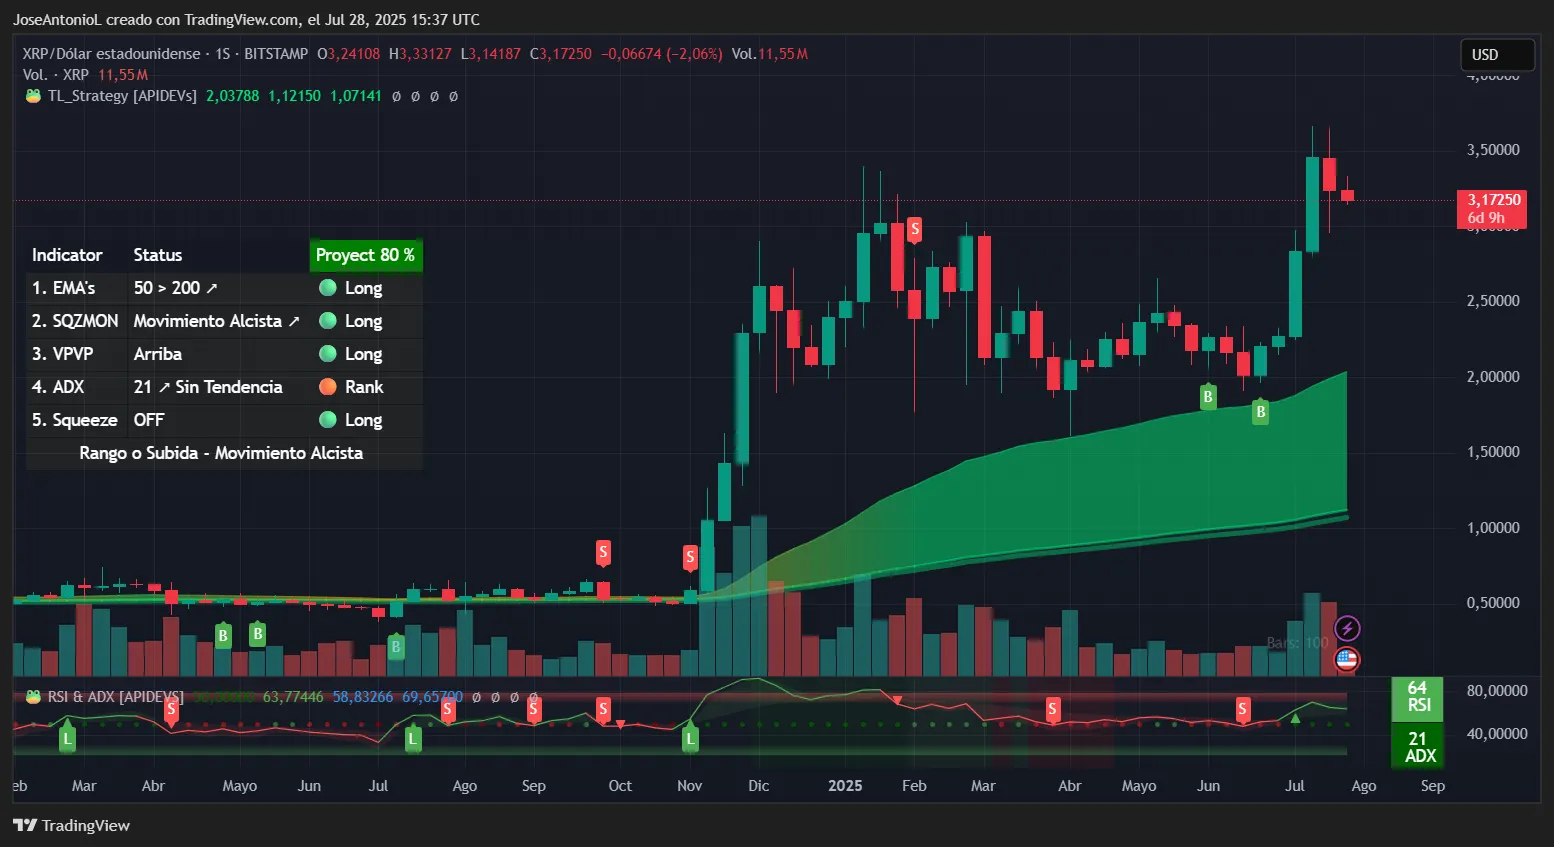
The Average Directional Index, or ADX, sits at 21, below the 25 threshold that typically confirms strong trend momentum. ADX is how traders measure the strength of a price trend, regardless of direction. This reading for XRP suggests the current bullish trend may be starting to lose its strong directional force—when ADX falls below 25, it often indicates the market is moving sideways or preparing for a new directional move. Traders typically wait for ADX to rise above 25 to confirm a new trend is establishing.
The Relative Strength Index, or RSI, however, indicates XRP maintains momentum in the upper range with 64 points without reaching overbought territory above 70. RSI is like a temperature gauge for markets for traders, measuring how hot a given asset might be getting from a scale of 0 to 100. At 64, the token isn't yet experiencing extreme buying pressure that often precedes pullbacks, and the overbought pressure may be slowing down.
Exponential Moving Averages, the average price of an asset over a set period of time, are other key indicators for most experienced traders. XRP’s EMAs show the coin trading above both the 50-week and 200-week EMAs. The 50-week EMA appears to be positioned above the 200-week EMA, which technical analysts often view as a bullish market structure.
The Squeeze Momentum Indicator shows “off” status on the weekly chart, indicating that the recent period of price compression has ended and volatility has been released.
Considering all these indicators together, the price movement is still respecting the support set by its double bottom pattern, so it still has space to correct (as it should) without losing its bullish outlook. When the ADX loses strength and the Squeeze momentum indicator also turns down, the probabilities for a correction increase.
What does that all add up to? Most traders WOULD interpret this as: more pain first, then more gains later.
:
:
Dogecoin price: Waiting for momentum
Dogecoin trades at $0.23283 with another double digit loss on the weekly chart, being the worst performing coin in the top 10 by market cap with an 18% drop in the last seven days. XRP and Cardano are the other coins with double-digit losses in the top 10.
The meme coin's technical indicators present a mixed picture as it consolidates above the $0.20 level.
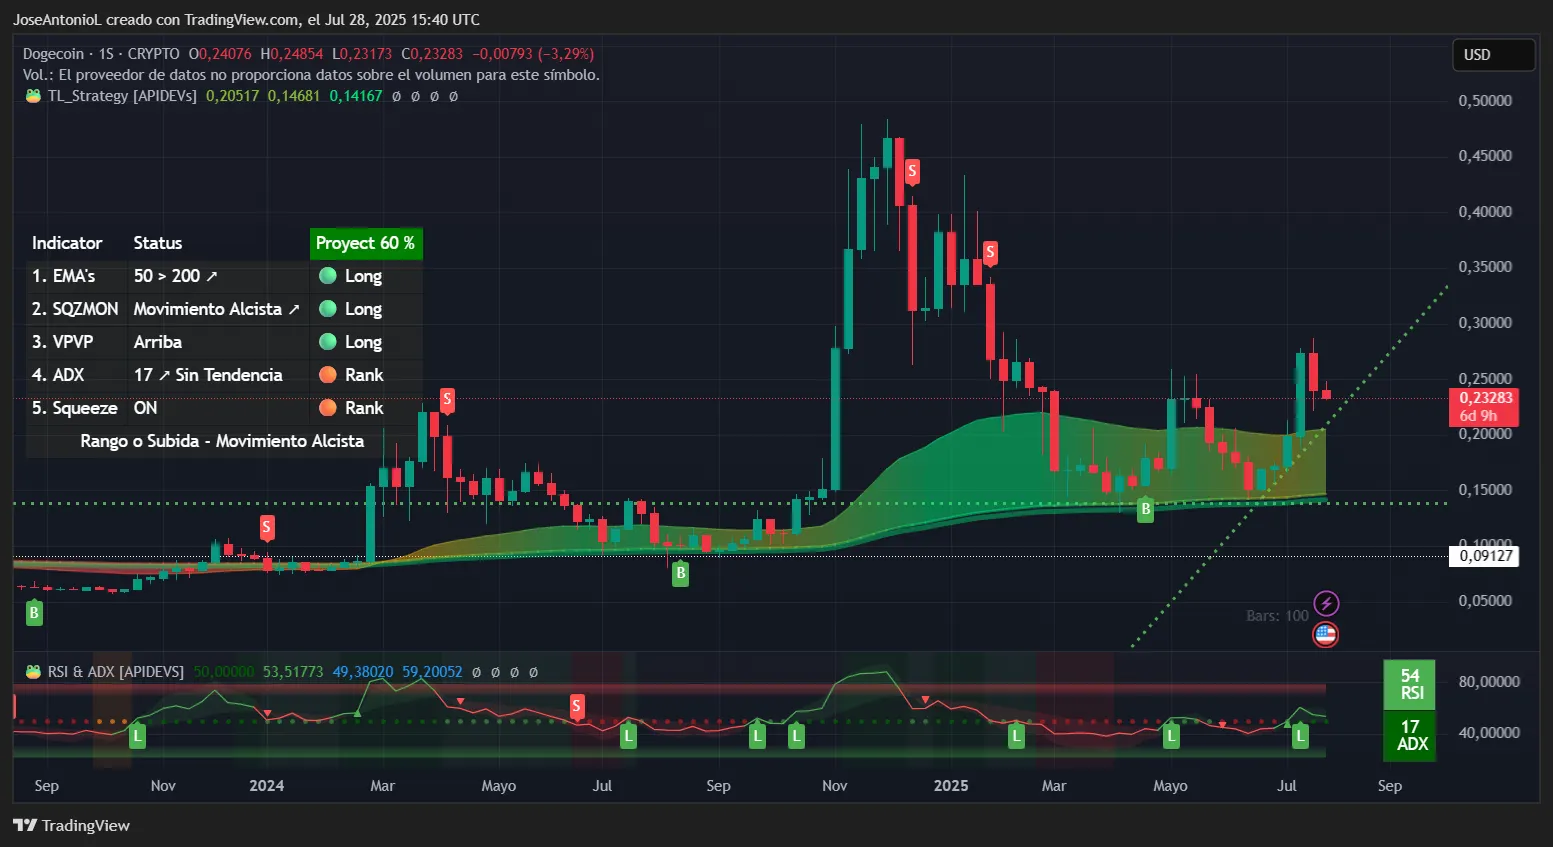
The ADX at 17 indicates no established trend—readings below 20 suggest the market lacks clear directional conviction. This low ADX reading is common during consolidation periods when neither buyers nor sellers have taken control of the price action.
The RSI at 54 places Doge in neutral territory, neither overbought nor oversold. This middle-ground reading indicates balanced momentum between buyers and sellers at current levels.
The relationship between DOGE's 50-week EMA and 200-week EMA shows these moving averages converging. While they appear close on the chart, traders typically wait for a clear crossover with separation before confirming a major trend change.
The Squeeze Momentum Indicator showing “on” status indicates the token is currently experiencing price compression. This suggests lower volatility that often precedes a larger MOVE in either direction.
In other words, traders are expecting a big move here to come, but they’re ready to say in which direction yet.
Note that DOGE is also experiencing a double bottom pattern (prices creating a W shaped pattern in the chart above), which traders usually interpret as bullish. Also, both supports have been respected in the weekly performance. So, unless things change and get even worse for DOGE holders, the price of DOGE could dip as much as another 10% without traders having to worry about a trend reversal just yet.
Disclaimer
The views and opinions expressed by the author are for informational purposes only and do not constitute financial, investment, or other advice.
