🚀 Uniswap’s UNI Eyes $14 Surge as Rounding Bottom Pattern Signals Bullish Breakout

Uniswap's governance token UNI isn't just breaking out—it's moonwalking past resistance with a chart pattern that'd make even Wall Street's TA-obsessed quants crack a smile.
The rounding bottom that matters
That textbook-perfect rounding bottom formation? It's flashing green for a potential run to $14—a move that'd leave bagholders from the last cycle kicking themselves for selling too early.
Liquidity hunters take note
With UNI already clearing key levels, the next battleground sits at that psychologically juicy $14 target. Cue the 'decentralized finance is the future' tweets from crypto influencers who three months ago were shilling memecoins.
Of course, in crypto-land, technical analysis is just astrology for finance bros—until it works. Then suddenly everyone's a charting genius.

After months of consolidation and gradual recovery, UNI broke through critical resistance in early July, establishing a new trend direction. While short-term volatility persists, the broader structure supports the potential for further upside, especially if key support levels continue to hold.
Rounding Bottom Structure Sets Up Technical Breakout
The daily UNI/USDT chart indicates the completion of a rounding bottom pattern that began in early 2025. This pattern, widely regarded as a bullish reversal indicator, formed after a prolonged downtrend from the $16 region.
Price gradually curved upward before breaking above the neckline resistance at $9.50 in mid-July. The breakout confirmed the reversal structure, with volume also rising on the right side of the pattern—an important confirmation of buying strength.
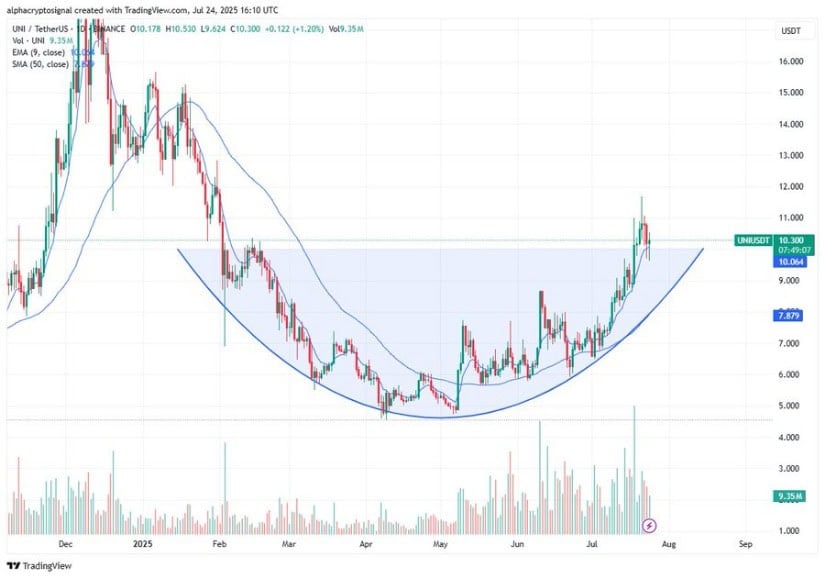
Following the breakout, UNI reached a high NEAR $12.80 before encountering resistance. As of writing, the token is trading near $10.30, slightly below recent highs but well above the neckline and key moving averages. Both the 9-day EMA and the 50-day SMA are sloping upward, serving as dynamic support.
The ongoing price action remains within the bullish territory, and the current setup suggests that a successful retest of support between $9.90 and $10.00 could trigger renewed buying momentum. Based on the height of the rounding bottom, the projected technical target for UNI stands around $13.50 to $14.00.
Volume and Short-Term Activity Reflect Mixed Sentiment
Over the past 24 hours, UNI experienced a pullback of 5.68%, closing at $10.17. The price traded within a range of $9.70 to $10.30, showing clear signs of intraday volatility. The decline followed an early rally that lost momentum, likely due to profit-taking and short-term speculative activity.
Multiple failed breakout attempts suggest that while sentiment remains generally positive, immediate buying pressure may be weakening.
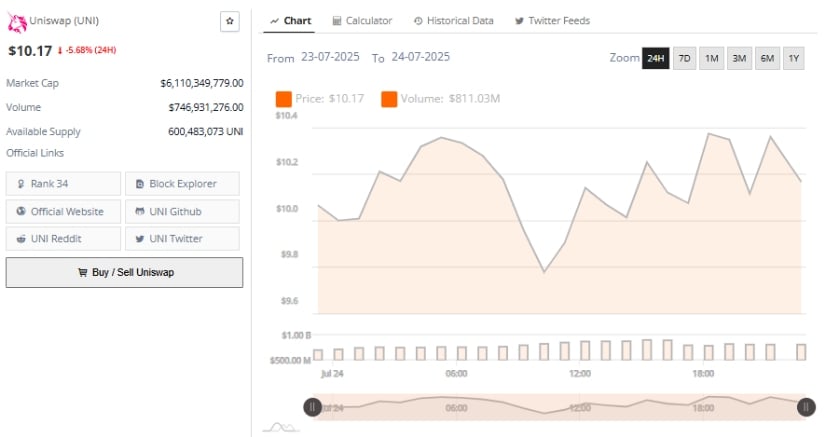
Source: BraveNewCoin
Trading volume for the same period reached $746.9 million, underscoring moderate market activity. Peak volume was observed during morning and evening sessions, aligning with intraday rallies. However, the overall volume profile remained flat, with no indication of sustained accumulation at higher levels.
The lack of strong follow-through after initial rallies implies that short-term resistance near $10.30 must be overcome with higher volume for the bullish trend to continue. Until that occurs, the risk of a pullback below $10 remains on the table, especially if broader market conditions shift.
Indicators Support Momentum Toward $13.50 Target
At the time of writing, UNI is priced at $10.51, with a market capitalization of approximately $6.11 billion. The daily MACD indicator confirms bullish momentum, with the MACD line (0.86) maintaining distance above the signal line (0.74), and the histogram printing consecutive positive bars.
The increasing divergence between the two lines suggests a continuation of the current uptrend unless disrupted by significant selling pressure.
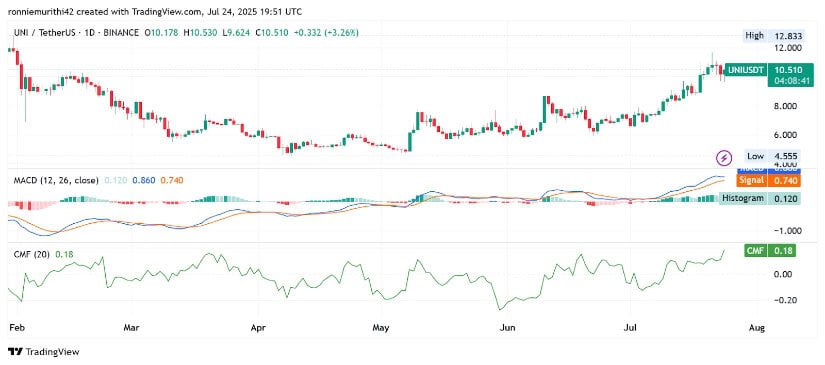
Source: TradingView
The Chaikin Money FLOW (CMF) is currently at +0.18, pointing to strong capital inflows into UNI. A CMF reading above 0.10 typically indicates sustained accumulation, which supports the case for further upside. The upward CMF trend since early July reinforces this, suggesting broader market confidence.
If CMF remains in this positive territory while the MACD stays in bullish alignment, UNI may soon test previous resistance levels around $12.80 and, if momentum builds, reach the projected $13.50–$14 range in the near term.
