🚀 Chainlink (LINK) Price Alert: Liquidity Model Predicts Parabolic Surge to $60

Chainlink's oracle network just flipped the switch on its liquidity model—and the algorithm screams breakout. Forget sideways action; LINK's gearing up for a moonshot.
### The $60 Target: Not a Matter of 'If' But 'When'
Market depth metrics suggest institutional accumulation at these levels. Whales aren’t nibbling—they’re swallowing whole order books. Retail traders? Still busy chasing meme coins.
### Why This Rally Has Teeth
Unlike 2021’s hype cycle, LINK’s fundamentals now back the pump. Real-world adoption (yes, that exists in crypto) meets tokenomics designed to punish paper hands.
### The Fine Print
Of course, Wall Street’s quant overlords will claim they saw it coming—right after they finish reverse-engineering the blockchain data they mocked three years ago. Price prediction models: always accurate in hindsight.

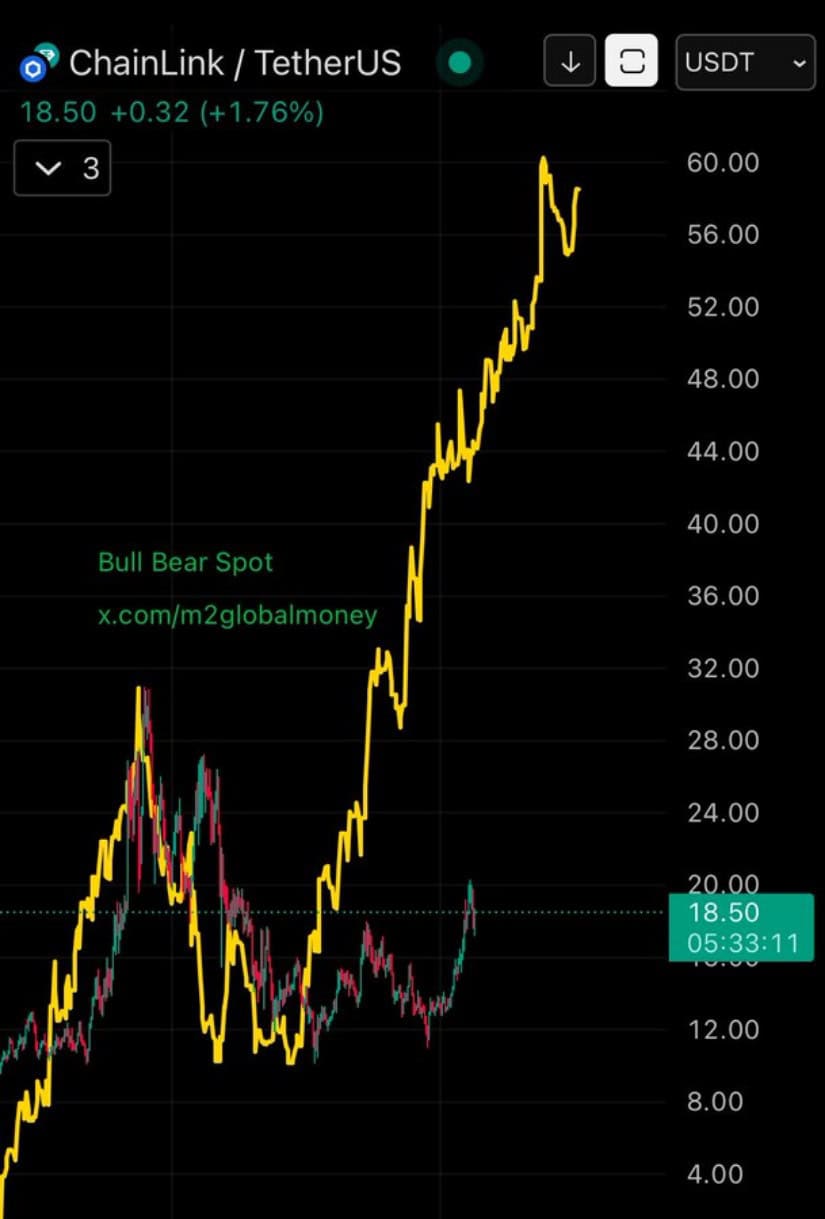
A comparison between LINK’s price and the M2 global money supply—highlighted in a chart shared by analyst Bull Bear Spot (@m2globalmoney)—suggests a structural similarity to previous parabolic phases.
At the time of writing, LINK is trading at $18.39, with a 1.16% daily gain, as technical indicators and liquidity overlays point toward a continuation of bullish momentum. The model implies a scenario where global capital flows could drive LINK toward the $60 region if the current structure holds.
Chainlink Mirrors M2 Liquidity Trend in Bullish Formation
The visual overlay of chainlink price against the M2 global liquidity curve shows a strong historical correlation, with each major LINK rally coinciding with surges in global money supply. The yellow trendline—used by Bull Bear Spot to represent M2 growth—shows a rising trajectory beginning near the $6–$9 accumulation zone and extending sharply upward through the current price range.
This divergence indicates that chainlink may be entering a liquidity-fueled expansion phase, with the price structure echoing early-cycle behavior from previous bull markets.
Source: X
From a technical standpoint, LINK has recently completed a multi-month rounding base and is now forming higher highs and higher lows—a hallmark of emerging bullish trends. The chart’s structure, combined with this liquidity model, suggests that a breakout above the $20 psychological level WOULD confirm the beginning of an acceleration phase.
Analysts using macro overlays see the alignment between the current pattern and past cycles as supportive of long-term upside, with key milestones projected at $32, $44, and $60 if liquidity dynamics remain favorable.
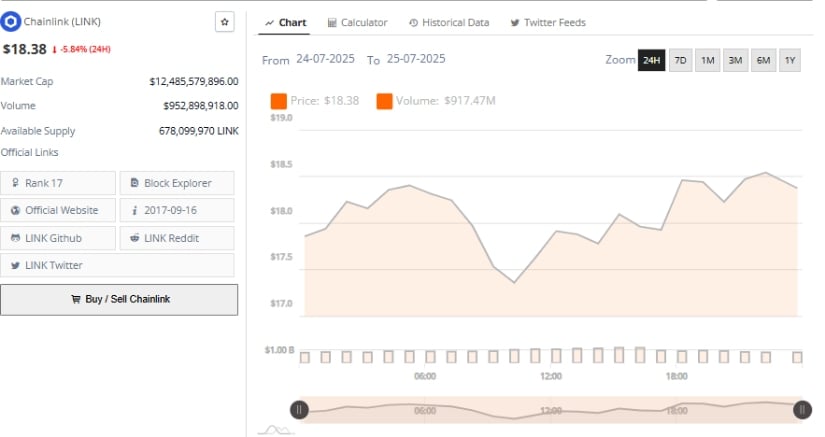
Intraday Volatility Signals Accumulation Zone Near $18
The 24-hour chart for LINK shows a turbulent session characterized by sharp swings. The price opened NEAR $17.60, surged above $18.40, and then sharply dropped back to $17.50 mid-morning, likely driven by short-term profit-taking.
This trough was followed by a gradual recovery throughout the day, with LINK reclaiming the $18.30–$18.40 level by session close. Despite ending the day with a 5.84% loss, the sequence of higher lows suggests accumulation at intraday dips.
Source: BraveNewCoin
Volume for the session totaled $917.47 million, reflecting high liquidity, although the lack of major spikes during the recovery phase hints at cautious Optimism rather than aggressive buying.
With a market cap of $12.48 billion and a circulating supply of 678 million LINK, the token remains one of the most actively traded mid-to-large-cap assets. Resistance at $18.80 continues to be a short-term ceiling. A strong MOVE above this level, supported by volume, could reinforce the larger macro model’s forecast.
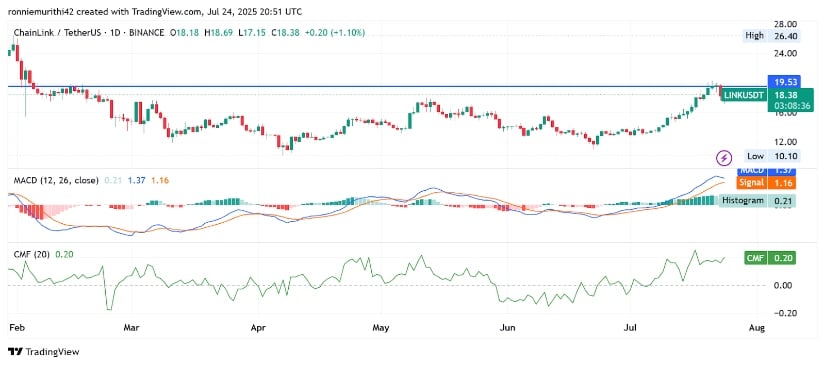
Indicators Point to Strength as $19.53 Becomes Pivotal
On the daily timeframe, LINK has recently tested and briefly reclaimed the $19.53 resistance—now acting as a pivotal level.
Maintaining support above this threshold is seen as essential for continuation toward higher resistance zones, notably $22.00 and $26.40. The chart shows a well-formed uptrend with clean breakout attempts, aligning with bullish momentum signals across multiple indicators.
Source: TradingView
The MACD line at 1.37 remains above the signal line at 1.16, and the histogram reads a positive 0.22, indicating that bullish momentum is intact, though not yet accelerating. Meanwhile, the Chaikin Money FLOW (CMF) stands at +0.20, a strong signal of continued capital inflow.
If LINK maintains this support while volume builds, the breakout above $20 could trigger a sharp rally, validating the $60 target proposed by the M2 liquidity overlay. Consolidation below $19.50 may delay this move, but the broader structure remains technically sound.
