Hyperliquid (HYPE) Price Prediction: Technicals & Fundamentals Align for Explosive $70+ Breakout

Hyperliquid (HYPE) is flashing bullish signals as technical indicators and on-chain metrics converge—fueling speculation of a run toward $70.
After months of sideways action, HYPE's chart structure finally mirrors its strong fundamentals. Liquidity pools are deepening, derivatives open interest is climbing, and that stubborn resistance at $65 looks ready to crack.
Traders who missed earlier rallies are now FOMO-ing into positions—because nothing motivates like the fear of missing the next 'sure thing' in crypto. (Spoiler: Past performance guarantees absolutely nothing.)
Watch for a decisive close above $70 to confirm the breakout. Below $60? The 'fundamentals were always overrated' crowd will emerge faster than a VC dumping tokens on retail.

Hyperliquid is starting to catch fresh attention after weeks of flying under the radar. With fundamentals breaking records and the price still playing catch-up, participants are now watching closely for what could be a major breakout move.
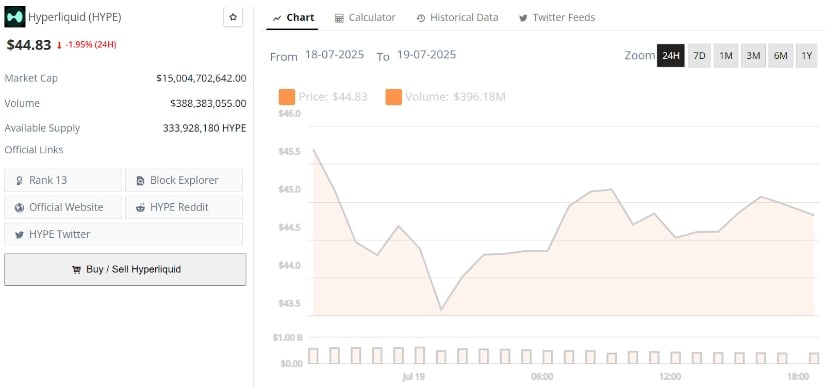
Hyperliquid’s current price is $44.83, down -1.95% in the last 24 hours. Source: Brave New Coin
Hyperliquid Fundamentals Hit Records While Price Lags
Hyperliquid is quietly setting the stage for something bigger. According to Henrik, nearly every major metric tied to the protocol is at an all-time high, except the price of $HYPE. Daily revenue has surpassed $6 million, open interest is sitting at a record-breaking $13.8 billion, and inflows over the past 10 days have totaled $1.25 billion. These metrics are expanding across the board.
What stands out here is the growing disconnect between backend fundamentals and token price. While $HYPE hasn’t yet reflected the protocol’s growth, that divergence may not last long. With daily active traders more than doubling in two weeks, from 20k to over 50k, liquidity is deepening and attention is building.
Hyperliquid Technical Chart Targets $70+ Range
Following up on the growing momentum around Hyperliquid, this chart shared by CryptoBusy shows a clean, Fibonacci-based roadmap that’s hard to ignore. The price is currently respecting a strong ascending trendline, with clear confluence around the 1.0 to 1.618 Fibonacci extension levels. If this structure holds, the target zone between $65 and $78 opens up as a logical next stop, what the chart refers to as the “HYPE POTENTIAL” zone.
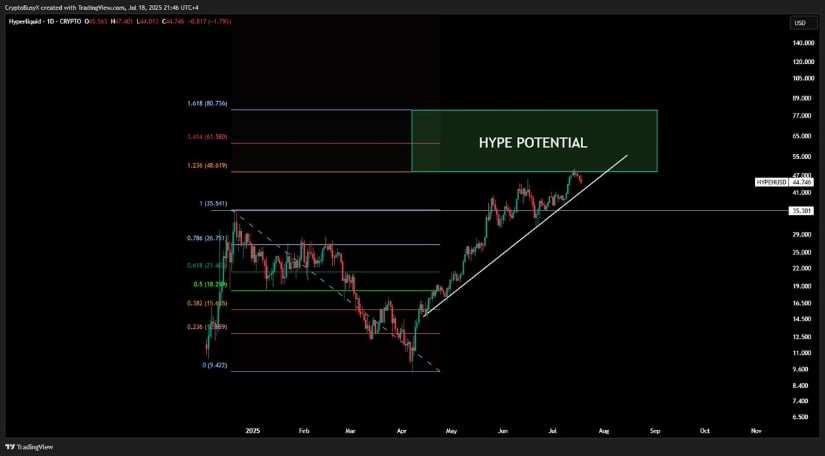
Hyperliquid holds its ascending trendline as Fibonacci targets between $65 and $78 come into focus. Source: CryptoBusy via X
What’s notable is how this technical setup mirrors the disconnect mentioned by Henrik, while fundamentals are accelerating, price is still in a catching-up phase. With trendline support intact and momentum climbing gradually without excessive volatility, HYPE is forming the kind of base that could enable sustained breakout moves.
HYPE Liquidity Map Points to $47.5 as the Next Key Zone
Adding to the bullish structure already in play, Naes highlights a key liquidity cluster forming around the $47.5 level. This latest heatmap from Coinglass shows strong bid and ask walls stacking at that zone. This is often the zone where large players are sitting.
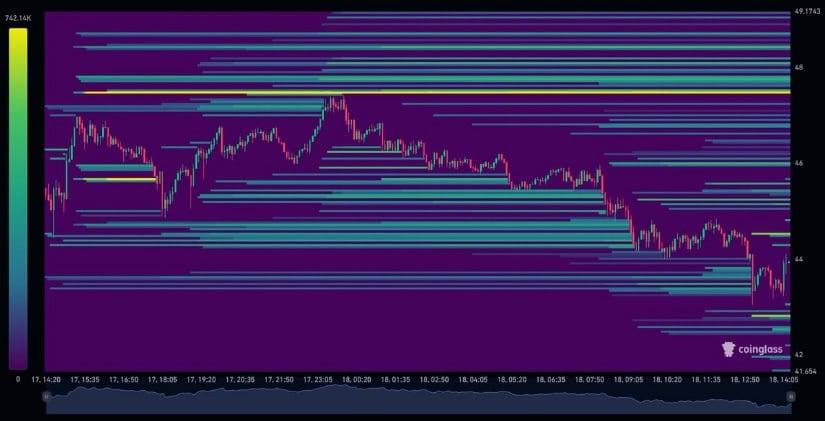
Hyperliquid’s liquidity heatmap reveals heavy interest around $47.5. Source: Naes via X
With price currently rebounding off the $43.50 region, the setup points to a near-term push toward that liquidity magnet before any major resistance kicks in.
The broader context remains consistent with earlier technicals: momentum is rising, structure is clean, and the market hasn’t overextended yet. While $47.5 may act as a short-term ceiling, flipping it into support could open the door for a retest of all-time highs as suggested. In markets like this, where fundamentals and technicals are starting to align, liquidity maps like this often tell what’s coming.
HYPE Indicator Confluence Sets Up Long-Term Bullish Structure
This latest chart from Viperr leans into a more measured, indicator-driven perspective, and it’s quietly reinforcing the bullish case. Price is currently resting just above the 50-day EMA, while still maintaining a clean channel inside the broader upward trend. The 200-day EMA sits comfortably below, acting as a deeper structural support in case of any pullbacks. What’s encouraging is that despite the recent dip, the price never broke below the structure, keeping the uptrend intact.
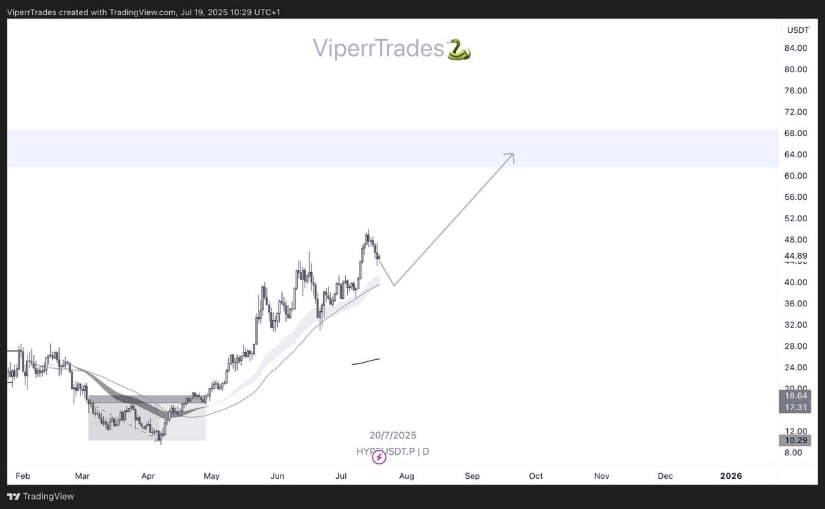
Hyperliquid holds above key EMAs as indicator alignment points toward a potential MOVE into the $65–$72 range. Source: Viperr via X
Crypto analyst Viperr has set $65 to $72 zone as the next target zone for the Hyperliquid price. It’s backed by historical rhythm and technical alignment. The EMA spread remains wide but not extreme, signaling trend continuation rather than exhaustion. Overall, the indicators aren’t screaming for caution yet; they’re aligning for what could be the next leg higher.
Final Thoughts
There’s something refreshingly different about how Hyperliquid is setting up. Instead of wild price swings or forced hype cycles, it’s building quietly on data, consistency, and structural strength. The market might still be catching up to what Hyperliquid is doing under the hood, but when both technicals and fundamentals begin to speak the same language, a potential right sign.
If the strength continues and key zones like $47.5 flip into support, it wouldn’t be surprising to see the $70+ range hit sooner than many expect. For now, the signals are clear: HYPE is building something with fundamentals on its back.
