XRP Price Alert: $2.17 Resistance Looms as $1.96 Support Holds Firm – Is a 2016-Style Flash Crash Imminent?

XRP traders are watching two numbers: a stubborn ceiling at $2.17 and a seemingly solid floor at $1.96. The asset is caught in a classic squeeze, and the tension on the chart is palpable.
The Ghost of Crashes Past
Analysts are dusting off charts from nearly a decade ago. The current technical setup shows an eerie resemblance to the conditions that preceded the infamous 2016 flash crash—a pattern that saw prices evaporate in a matter of hours. History doesn't repeat, but it often rhymes, especially in crypto markets where collective memory is notoriously short.
The Bull and Bear Tug-of-War
Every test of the $1.96 support level has, so far, been met with aggressive buying. That's the bullish signal. The bearish counterpoint? Each rally toward the $2.17 resistance has fizzled out, rejected like a bad check. This creates a narrowing range, and something has to give. Breakouts, when they come from these formations, are often violent.
What Comes Next?
The next major price move will likely be dictated by which of these two key levels breaks first. A decisive close above $2.17 could open the path for a significant leg up, invalidating the crash comparison. A failure to hold $1.96, however, might see the bears take full control, potentially triggering stop-loss cascades that mirror past collapses. It's a high-stakes game of technical chicken—just another day in the digital casino of modern finance.

The cryptocurrency market is paying close attention to Ripple’s XRP as short-term volatility rises amid concentrated supply zones. Glassnode’s on-chain metrics, including the URPD (UTXO Realized Price Distribution), highlight clusters where holders’ cost bases are densest. This provides insight into potential market reactions, making XRP’s current position relevant for both retail and institutional traders.
Key Resistance and Support Levels
Blockchain analytics firm Glassnode identifies three critical price levels for XRP. The $2.17 mark represents a significant resistance area where a large volume of XRP was accumulated. Conversely, $1.96 and $1.78 serve as support zones with high holder concentration.
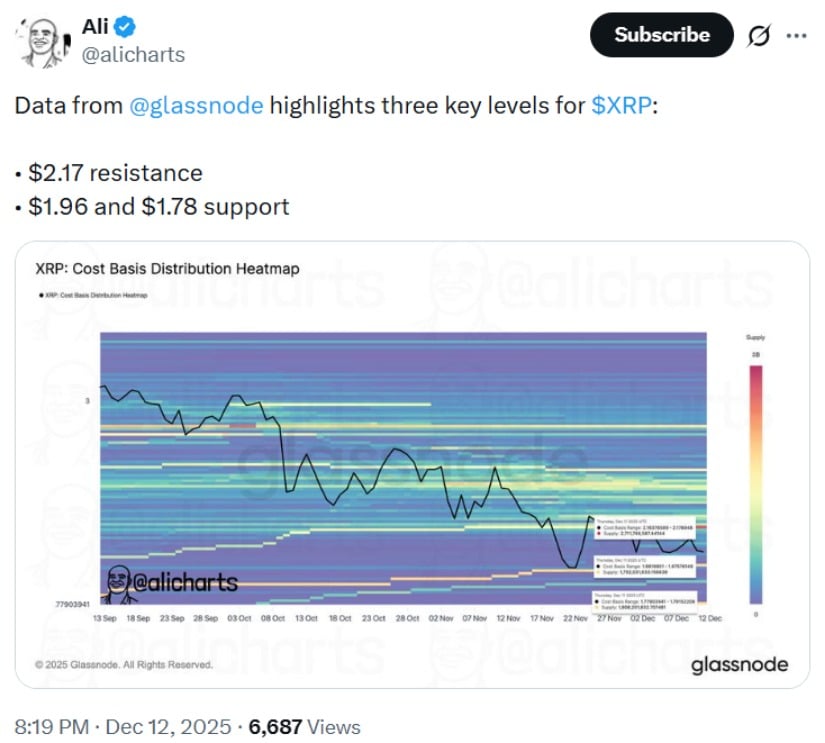
XRP hovers between key support at $1.96–$1.78 and resistance at $2.17, highlighting critical levels for traders. Source: @alicharts via X
Ali, an on-chain analyst who regularly studies holder distributions and supply clustering, notes, “Breaking $2.17 could relieve short-term profit pressure. Conversely, a drop below $1.96 might trigger increased selling from holders who purchased at higher prices.”
These levels are meaningful because they reflect the underlying distribution of XRP holdings. Traders often watch such zones closely, as moves above resistance or below support can lead to heightened volatility.
Historical Parallels and Scenario Analysis
Technical analyst ChartNerd, known for comparing historical crypto cycles, draws a parallel to XRP’s 2016–2017 cycle. After rejecting an accumulation supply block in Q4 2016, XRP experienced a 69% ABC-structured flash crash before eventually surging more than 110,000%.
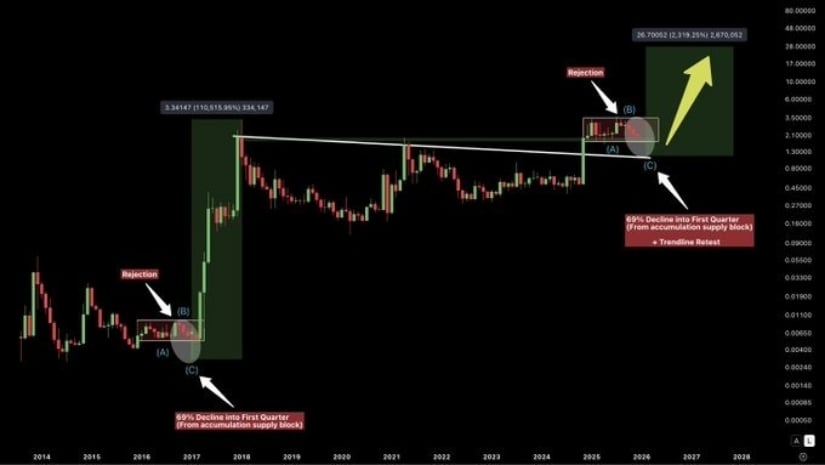
XRP could experience a sharp pullback to the low $1 range if a historical ABC flash crash pattern repeats, potentially setting the stage for a long-term rally toward $27 by 2026. Source: @ChartNerdTA via X
ChartNerd notes, “If a similar setup occurs this year, a sharp correction could push XRP toward the low $1 range before stabilizing. This scenario is not a prediction but a historical analogy highlighting potential market behavior under concentrated supply conditions.”
It’s important to contextualize this comparison. XRP’s market today is more mature, with higher liquidity and evolving regulatory oversight, including ongoing Ripple SEC developments. This limits direct parallels with past cycles, meaning historical patterns serve as illustrative rather than predictive tools.
Market Consolidation and Technical Signals
TradingView analyst SwallowAcademy, who focuses on technical analysis of crypto price structures, observes that XRP is currently compressed between established support levels and exponential moving averages (EMAs).

XRP is consolidating between key support and EMAs, creating price pressure that could lead to a stronger MOVE once a breakout occurs, with buyers needing a clear push above EMAs to regain momentum. Source: SwallowAcademy via X
“Price compression between EMAs and support zones often precedes larger moves, as reduced liquidity amplifies volatility,” the analyst explains.
Buyers have maintained the $1.96 support, but regaining momentum may require a clear market structure break (MSB) above the EMAs. A successful breakout could push XRP toward the $2.17 resistance, whereas failure to hold support may increase near-term volatility. Historical patterns indicate that consolidation in such zones typically precedes directional decisions.
XRP Market Outlook
XRP’s current price action is attracting attention from both retail and institutional investors. On-chain data, technical signals, and volume trends suggest that short-term volatility could increase as the cryptocurrency tests its critical levels.
Analysts emphasize that observing multiple indicators together provides a more comprehensive market view. Consolidation NEAR EMAs, coupled with dense holder clusters, often indicates reduced liquidity, which can amplify price swings. Traders should note that while historical analogs provide context, present-market differences, such as regulatory developments and liquidity depth, affect potential outcomes.
Final Thoughts
XRP remains at a key junction, balancing between critical support at $1.96 and resistance near $2.17. While historical analogs highlight potential flash-crash scenarios, current consolidation and multi-month support suggest the market retains stability.
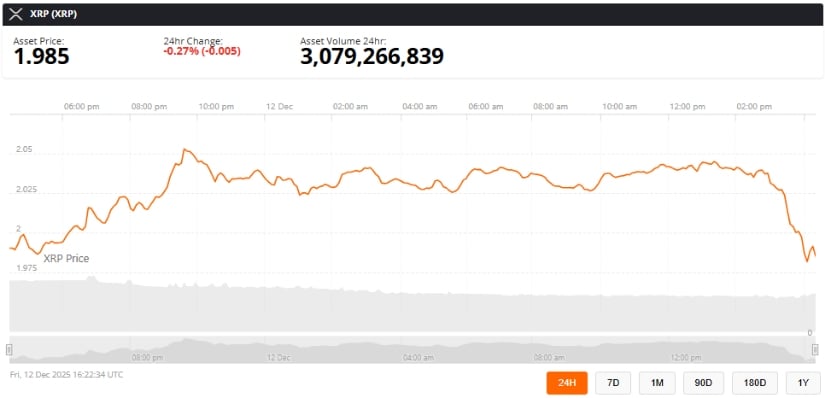
XRP was trading at around 1.98, down 0.27% in the last 24 hours at press time. Source: xrp price via Brave New Coin
Investors and traders are encouraged to monitor on-chain metrics, trading volume, and technical indicators to better understand market dynamics. Combining these insights allows for a more nuanced perspective on XRP’s short- and medium-term outlook while accounting for inherent uncertainties in the cryptocurrency market.
