Ethereum Price Prediction: Evening Doji Star Sparks Bearish Fears—Is ETH Price Heading Back to $3,000?

A chilling candlestick pattern flashes on Ethereum's chart—traders are bracing for impact.
The Doji's Warning Shot
That ominous Evening Star formation isn't just technical noise. It signals a potential momentum shift that could send ETH tumbling toward the $3,000 psychological floor. The market's holding its breath.
Beyond the Chart: The Real Pressure
Forget the lines on a screen. The real test is whether Ethereum's ecosystem growth can outpace macro headwinds and the relentless 'what have you done for me lately' sentiment from institutional money—the same crowd that still thinks a blockchain is something you buy at Home Depot.
Not a Forecast, But a Fork in the Road
This isn't about predicting a price. It's about recognizing a moment. The next major move gets decided here: a swift rejection of bearish pressure or a sobering retreat. The network's fundamentals are stronger than ever, but in crypto, sometimes the tape doesn't care.

After briefly reclaiming $3,200, ethereum now faces renewed pressure from technical indicators and resistance zones that continue to limit upside. With traders watching for confirmation of a potential reversal pattern, the next few sessions may determine whether ETH stabilizes or slips into a deeper corrective phase.
Ethereum Approaches Key Resistance at $3,400
Based on Ethereum’s daily chart on TradingView, price has been grinding upward toward the $3,400 resistance area, a level that has stopped rallies multiple times since late November. This zone aligns with a cluster of previous high-volume nodes and marks the upper boundary of a short-term consolidation structure.
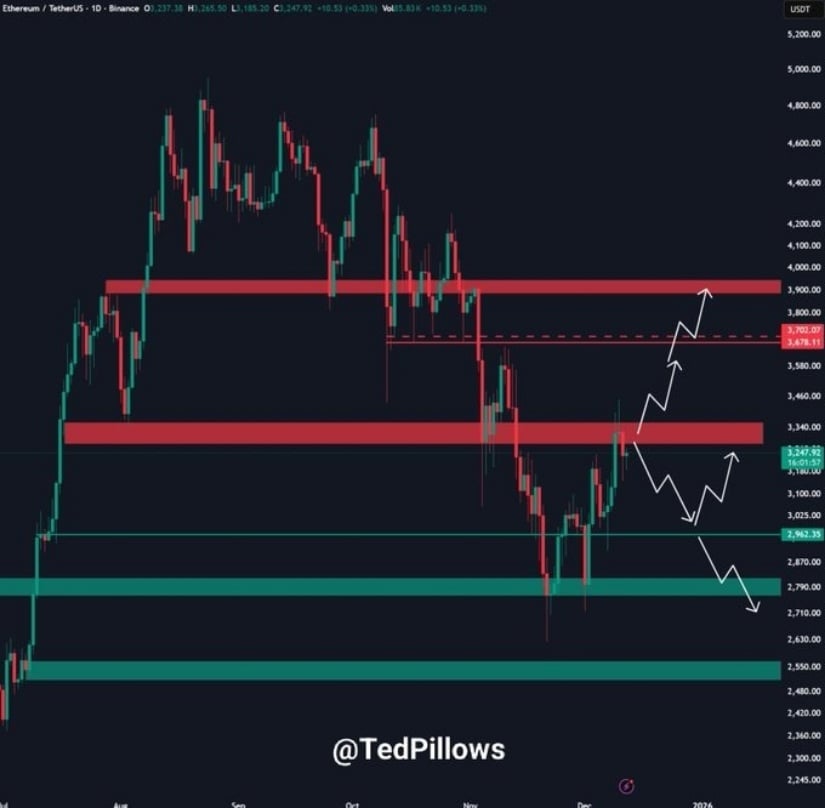
ETH approaches a critical resistance: a daily close above $3,400 could ignite a run to $3,700–$3,800, while rejection may send it back toward $3,000. Source: @TedPillows via X
Analyst Ted (@TedPillows) emphasized the importance of this level, noting that a strong candle close above it historically improves the probability of a continuation rally: “A daily close above the $3,400 level will push ETH towards the $3,700–$3,800 zone,” Ted wrote on X, warning that a failed breakout could result in a return to $3,000 support.
ETH recently pulled back from a high near $3,326 and dipped to $3,165, according to Coinbase and Binance spot market data reviewed for this report. This movement reflects broader uncertainty in the crypto market, as shifting ETF flows and regulatory headlines continue to influence sentiment.
Evening Doji Star Raises Bearish Concerns
A separate analysis from Ali (@alicharts) highlights a potential Evening Doji Star, a three-candle pattern that often signals slowing bullish momentum. On Ethereum’s daily chart, this structure formed NEAR the upper boundary of resistance, where reversals are more statistically meaningful.
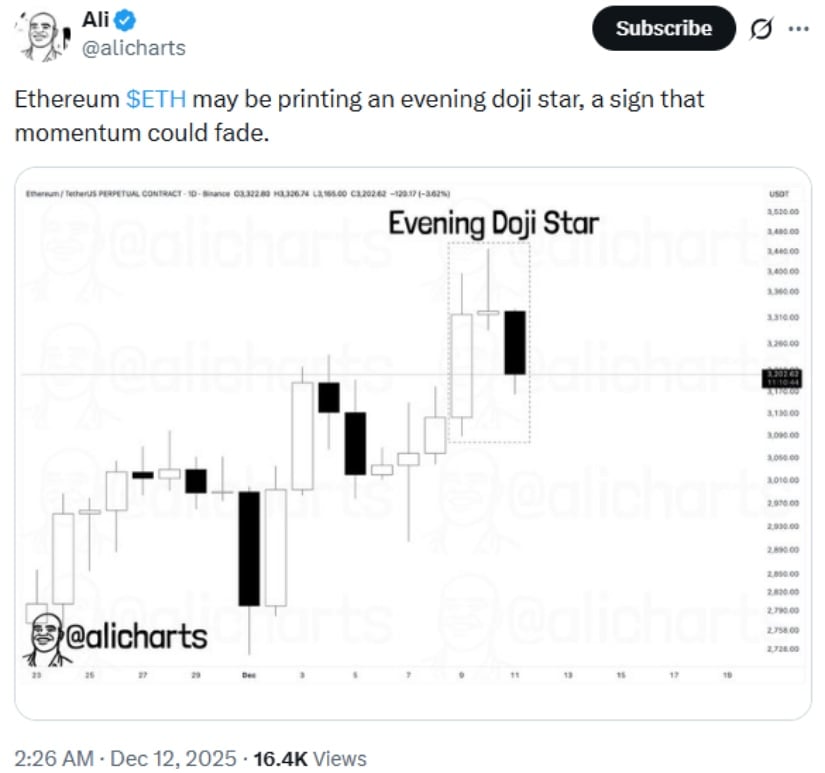
ETH may be forming an evening doji star, a warning sign that bullish momentum could be weakening. Source: @alicharts via X
According to Ali’s review of the 1D Binance ETH perpetual chart, “Ethereum may be printing an evening doji star, a sign that momentum could fade.”
For context, this pattern includes:
-
A strong bullish candle
-
A small-bodied doji showing indecision
-
A red candle closing below the midpoint of the doji
While this setup does not guarantee a pullback, it is considered a cautionary signal, especially near major resistance levels. Historically, Ethereum has seen short-term retracements of 6–12% after similar candle formations during consolidation phases.
Short-Term Outlook Hinges on the $3,190 Level
TradingView analyst Bahardiba, known for identifying structural support and resistance zones in trending markets, points to $3,190 as a key level. “If Ethereum stabilizes above 3190, it could rise up to 3450,” the analyst explained.
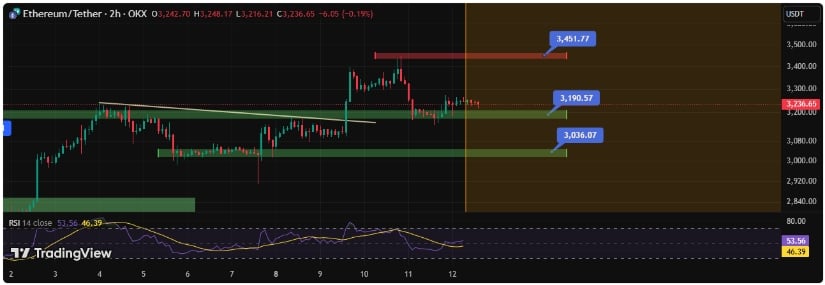
ETH sits at a key decision point: holding $3,190 could send it to $3,450, while losing it opens a drop toward $3,036. Source: bahardiba on TradingView
This aligns with the 50-day moving average and sits just above the mid-range equilibrium of ETH’s current trading channel. A sustained hold above $3,190 WOULD keep bullish momentum intact and maintain the possibility of an upward test toward $3,450 and the higher resistance at $3,700.
However, losing this level could shift the balance of probability toward further downside. Historical patterns show that when Ethereum breaks below a mid-range support without an immediate recovery, the price often gravitates toward the next major liquidity pool. In this case, that area sits near $3,036, a zone that has previously acted as a high-demand region during corrective phases.
This makes $3,190 a structural pivot, one that traders monitoring Ethereum price prediction next week will be watching closely.
Final Thoughts
Ethereum’s price structure is at a critical juncture. A confirmed Evening Doji Star near the $3,400 resistance level suggests weakening buying pressure and increases the likelihood of a retest of the $3,000–$3,036 support range. But if bulls manage to secure a daily close above $3,400, the upside targets of $3,450, $3,700, and even $3,800 remain within reach.
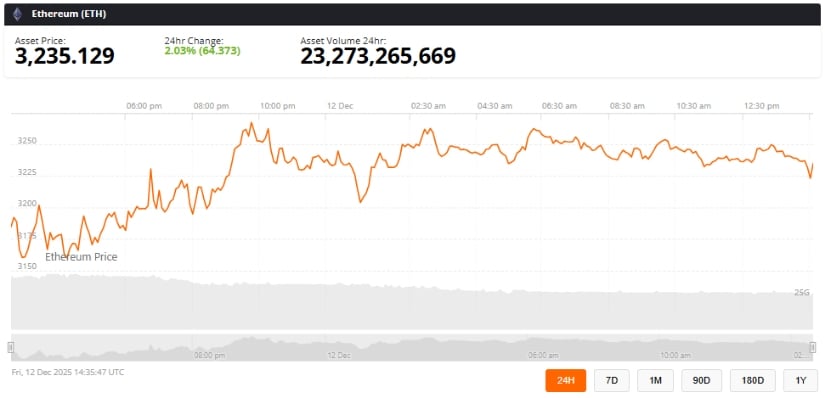
Ethereum was trading at around 3,235, up 2.03% in the last 24 hours at press time. Source: ethereum price via Brave New Coin
For now, the market appears to be entering a data-dependent phase where price direction will be heavily influenced by chart confirmations, ETF FLOW trends, and broader macro sentiment. Traders should remain aware of the speculative nature of crypto markets, as volatility can accelerate quickly when technical levels converge.
A clearer trend is likely to emerge in the next few daily candles, offering better insight into whether Ethereum prepares for another leg higher or slips into a broader correction.
