Bitcoin’s Liquidity Map Signals $107K & $110.5K as Make-or-Break Targets – Here’s Why Traders Are Watching

Bitcoin's liquidity map just lit up with two flashing price targets—and the bulls won't like being patient. $107,000 and $110,500 now stand as critical resistance levels that could dictate BTC's next major move.
Why these numbers matter:
Liquidity clusters at these price points act like gravitational pull for Bitcoin's price action. Whales accumulate positions here, exchanges stack order books, and algo traders salivate at the volatility spikes. Forget 'fundamentals'—this is pure market mechanics at work.
The cynical take? Wall Street's suddenly rediscovered 'digital gold' now that their bond portfolios are bleeding. But for once, their late arrival might actually help push BTC past these targets—if the liquidity holds.
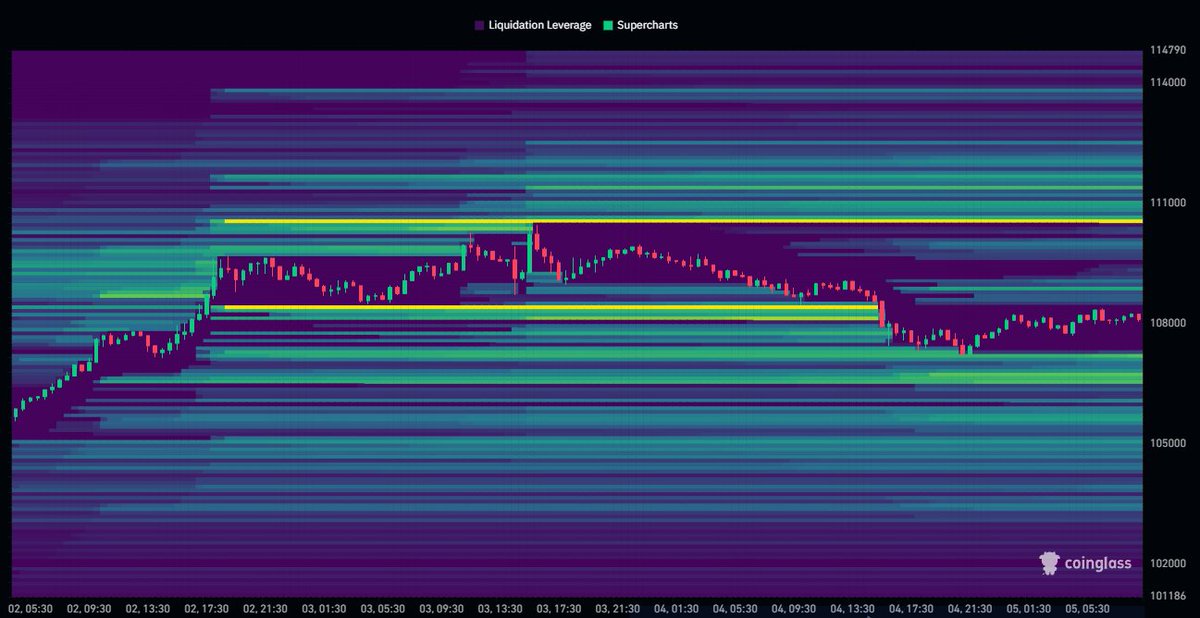
The Imminent Bitcoin Battle Fronts: $107,000 And $110,500
In an X post on July 5, Daan Crypto shares a critical insight on Bitcoin’s potential price action relative to liquidity levels. With data from Coinglass, the renowned analyst explains that Friday’s price activity led to a large-scale liquidation of Leveraged positions centered around the $108,000 region. Following this development, investors’ interest is now focused toward new liquidity zones, forming around $107,000 and $110,500.
Of the highlighted regions, the $107,000 region appears to be serving as the immediate support, with some traders defending positions that survived the recent liquidation. Therefore, BTC is likely to experience a short-term rebound upon retesting this level. However, a price dip below $107,000 WOULD trigger large scale liquidations forcing prices to regions as low as $100,000 in line with recent range-bound movement.
Meanwhile, $110,500 is emerging as a near-term resistance where potential sell pressure or short entries could stack up, especially if Bitcoin attempts another breakout. A successful price close above this level would eliminate multiple short positions inducing a short squeeze that could result in Bitcoin swiftly moving past its current all-time high of $111,970 into uncharted price territory.
Overall, the BTC market appears to be stabilizing within the $107,000–$110.5,000 zone following Friday’s sharp liquidation sweep. This sideways price movement typically sets the stage for a swift breakout or breakdown.
Bitcoin Exchange Leverage Reaches New High
In other developments, CryptoQuant data reveals that bitcoin traders are showing high market appetite as the estimated leverage ratio across all exchanges has reached a new yearly high of 0.27. This metric which tracks the amount of open interest relative to exchange BTC reserves shows an elevated risk behavior as traders are increasingly deploying borrowed capital in anticipation of larger price movements.
Meanwhile, the premier cryptocurrency continues to trade around $108,232 reflecting market gains of 0.70% and 6.41% on the weekly and monthly chart, respectively. With a market cap of $2.15 trillion, Bitcoin retains a market dominance of 64.6% as the largest VIRTUAL asset in the world.
