HBAR’s Summer Rally Cools Off—Is a Drop Below $0.20 Inevitable?

HBAR bulls are sweating as the token's summer surge loses steam. After flirting with higher valuations, the threat of sub-$0.20 levels now looms large—just in time to ruin everyone's crypto beach vibes.
Market watchers eye key support levels as traders brace for potential downside. The usual suspects—macro uncertainty, profit-taking, and that one whale who always dumps at the worst time—are all lining up to spoil the party.
Meanwhile, traditional finance bros are already crafting 'I told you so' tweets about volatility. Because nothing says 'secure store of value' like watching your portfolio swing 20% before lunch.
HBAR’s Futures Market Cools as Sellers Tighten Grip
HBAR’s rally, which peaked at $0.3050 on July 27, has lost momentum. Exchanging hands at $0.2427 as of this writing, the altcoin’s value has since dipped by 11%.
According to Coinglass, HBAR’s open interest in its futures market is falling sharply, signaling that derivatives traders are backing away from bullish bets. At press time, it stood at $349.35 million, plunging 11% in the past seven days.
: Want more token insights like this? Sign up for Editor Harsh Notariya’s Daily crypto Newsletter here.
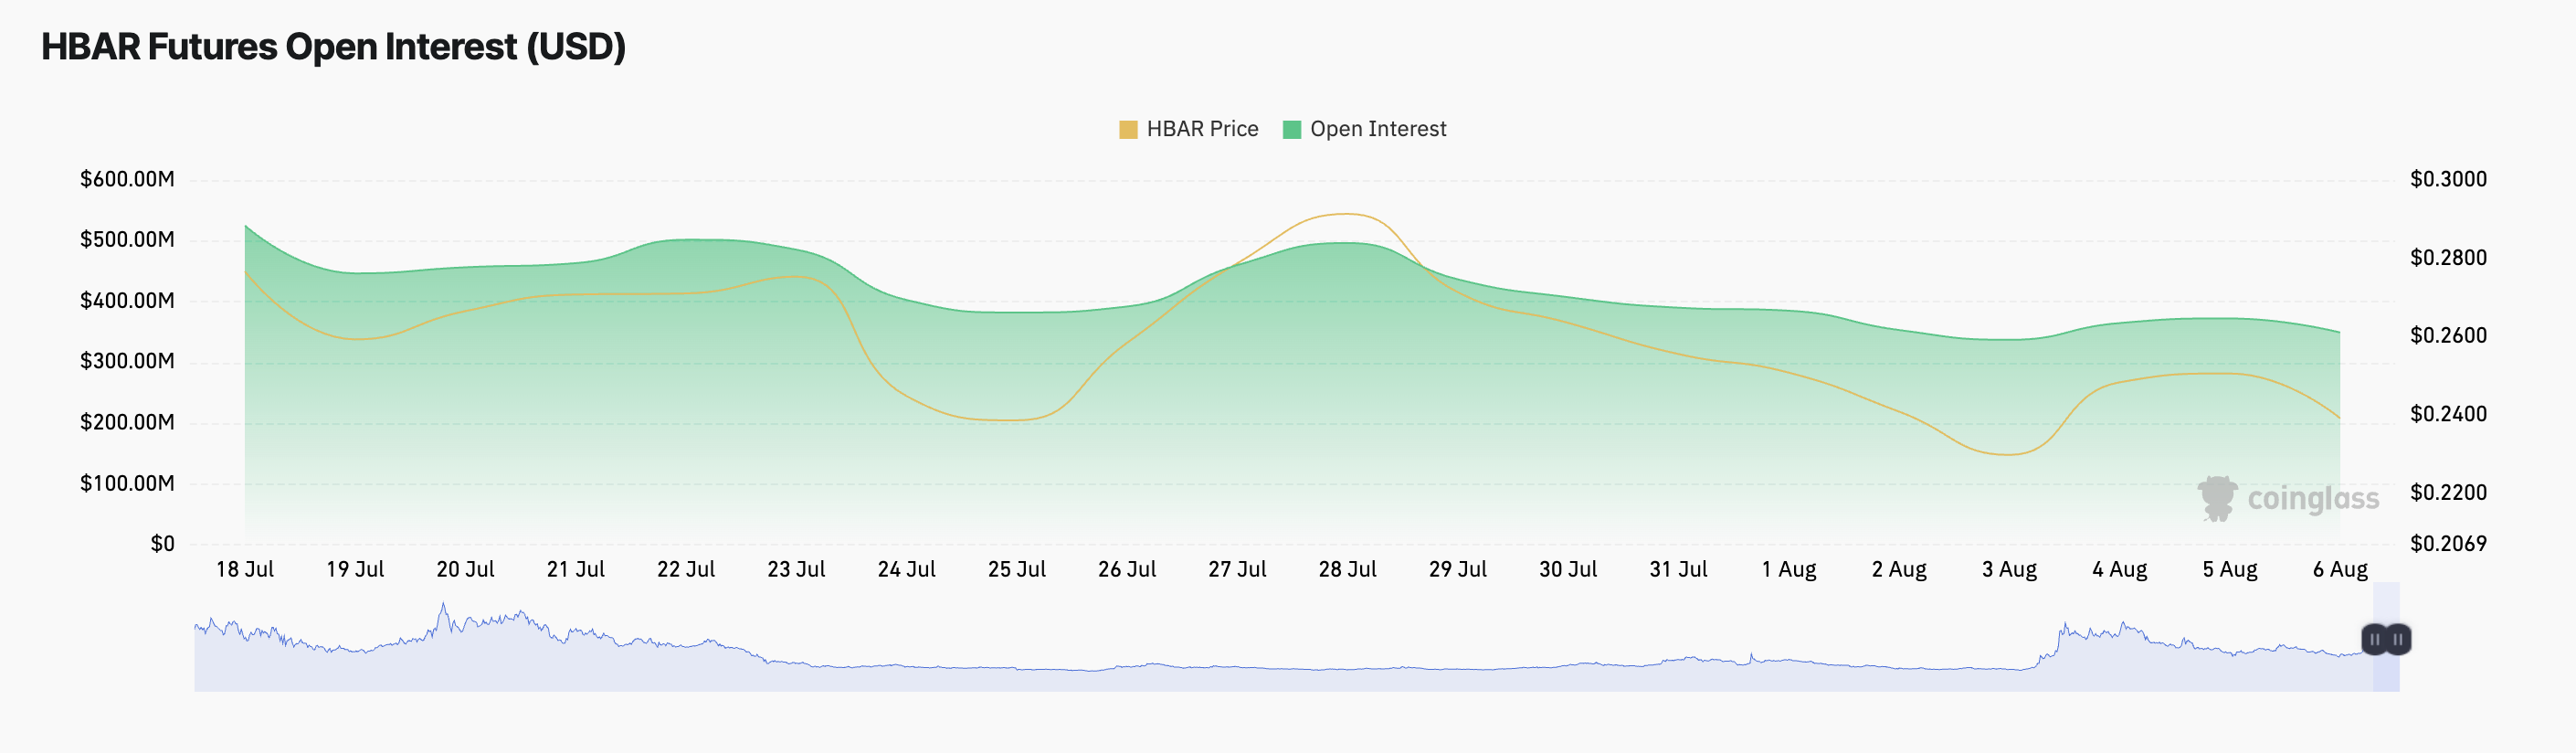
An asset’s open interest tracks the total number of active futures or options contracts. When it rises, it signals growing market participation, while a decline indicates that traders are closing positions and stepping away from the market.
For HBAR, the recent drop in futures open interest suggests a clear loss of momentum among derivatives traders. Fewer participants are betting on a near-term rebound, reflecting the weaker accumulation trend in spot markets.
This weak accumulation trend is also mirrored in HBAR’s Elder-Ray Index, which has printed negative values for the past six consecutive trading sessions on the daily chart.
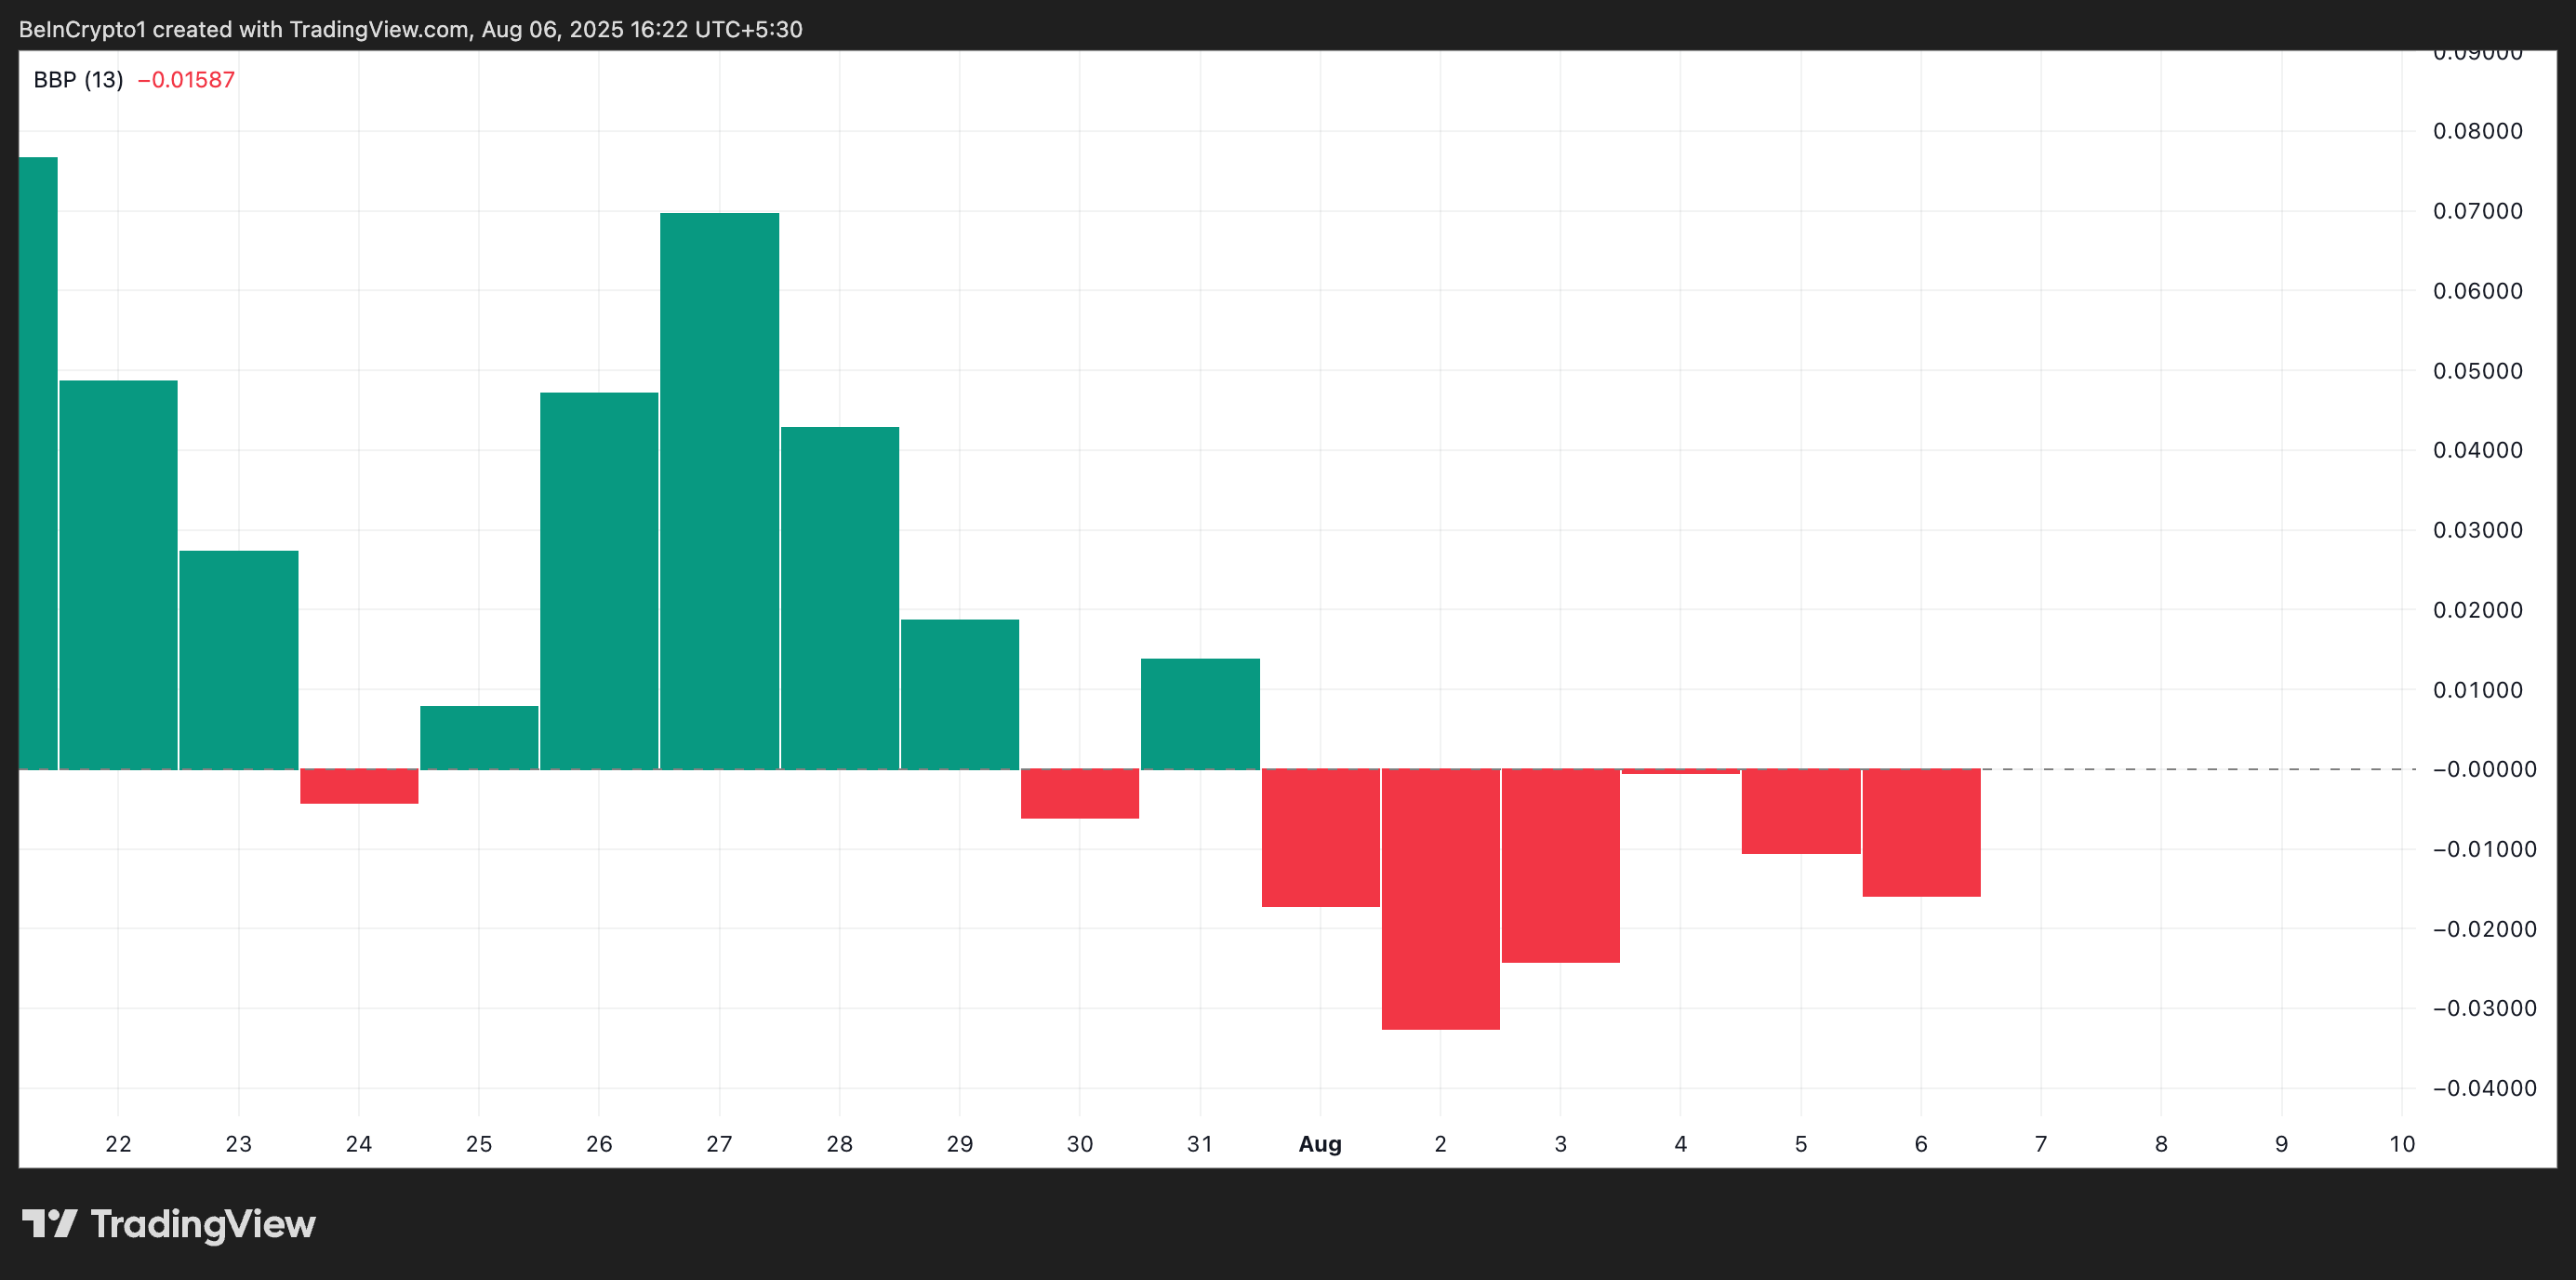
This momentum indicator measures the balance of buying and selling pressure by comparing price action against a moving average. Positive values suggest buyers are in control, while negative readings indicate sellers have the upper hand.
The recent stretch of red histogram bars signals sustained selling dominance and fading bullish momentum in the HBAR market.
Hedera Support Under Pressure
At its current value, HBAR hovers above support at $0.2366. If demand falls further and this support floor weakens, a price decline to $0.2155 could occur. In case this level also gives way, HBAR could trade at $0.1944
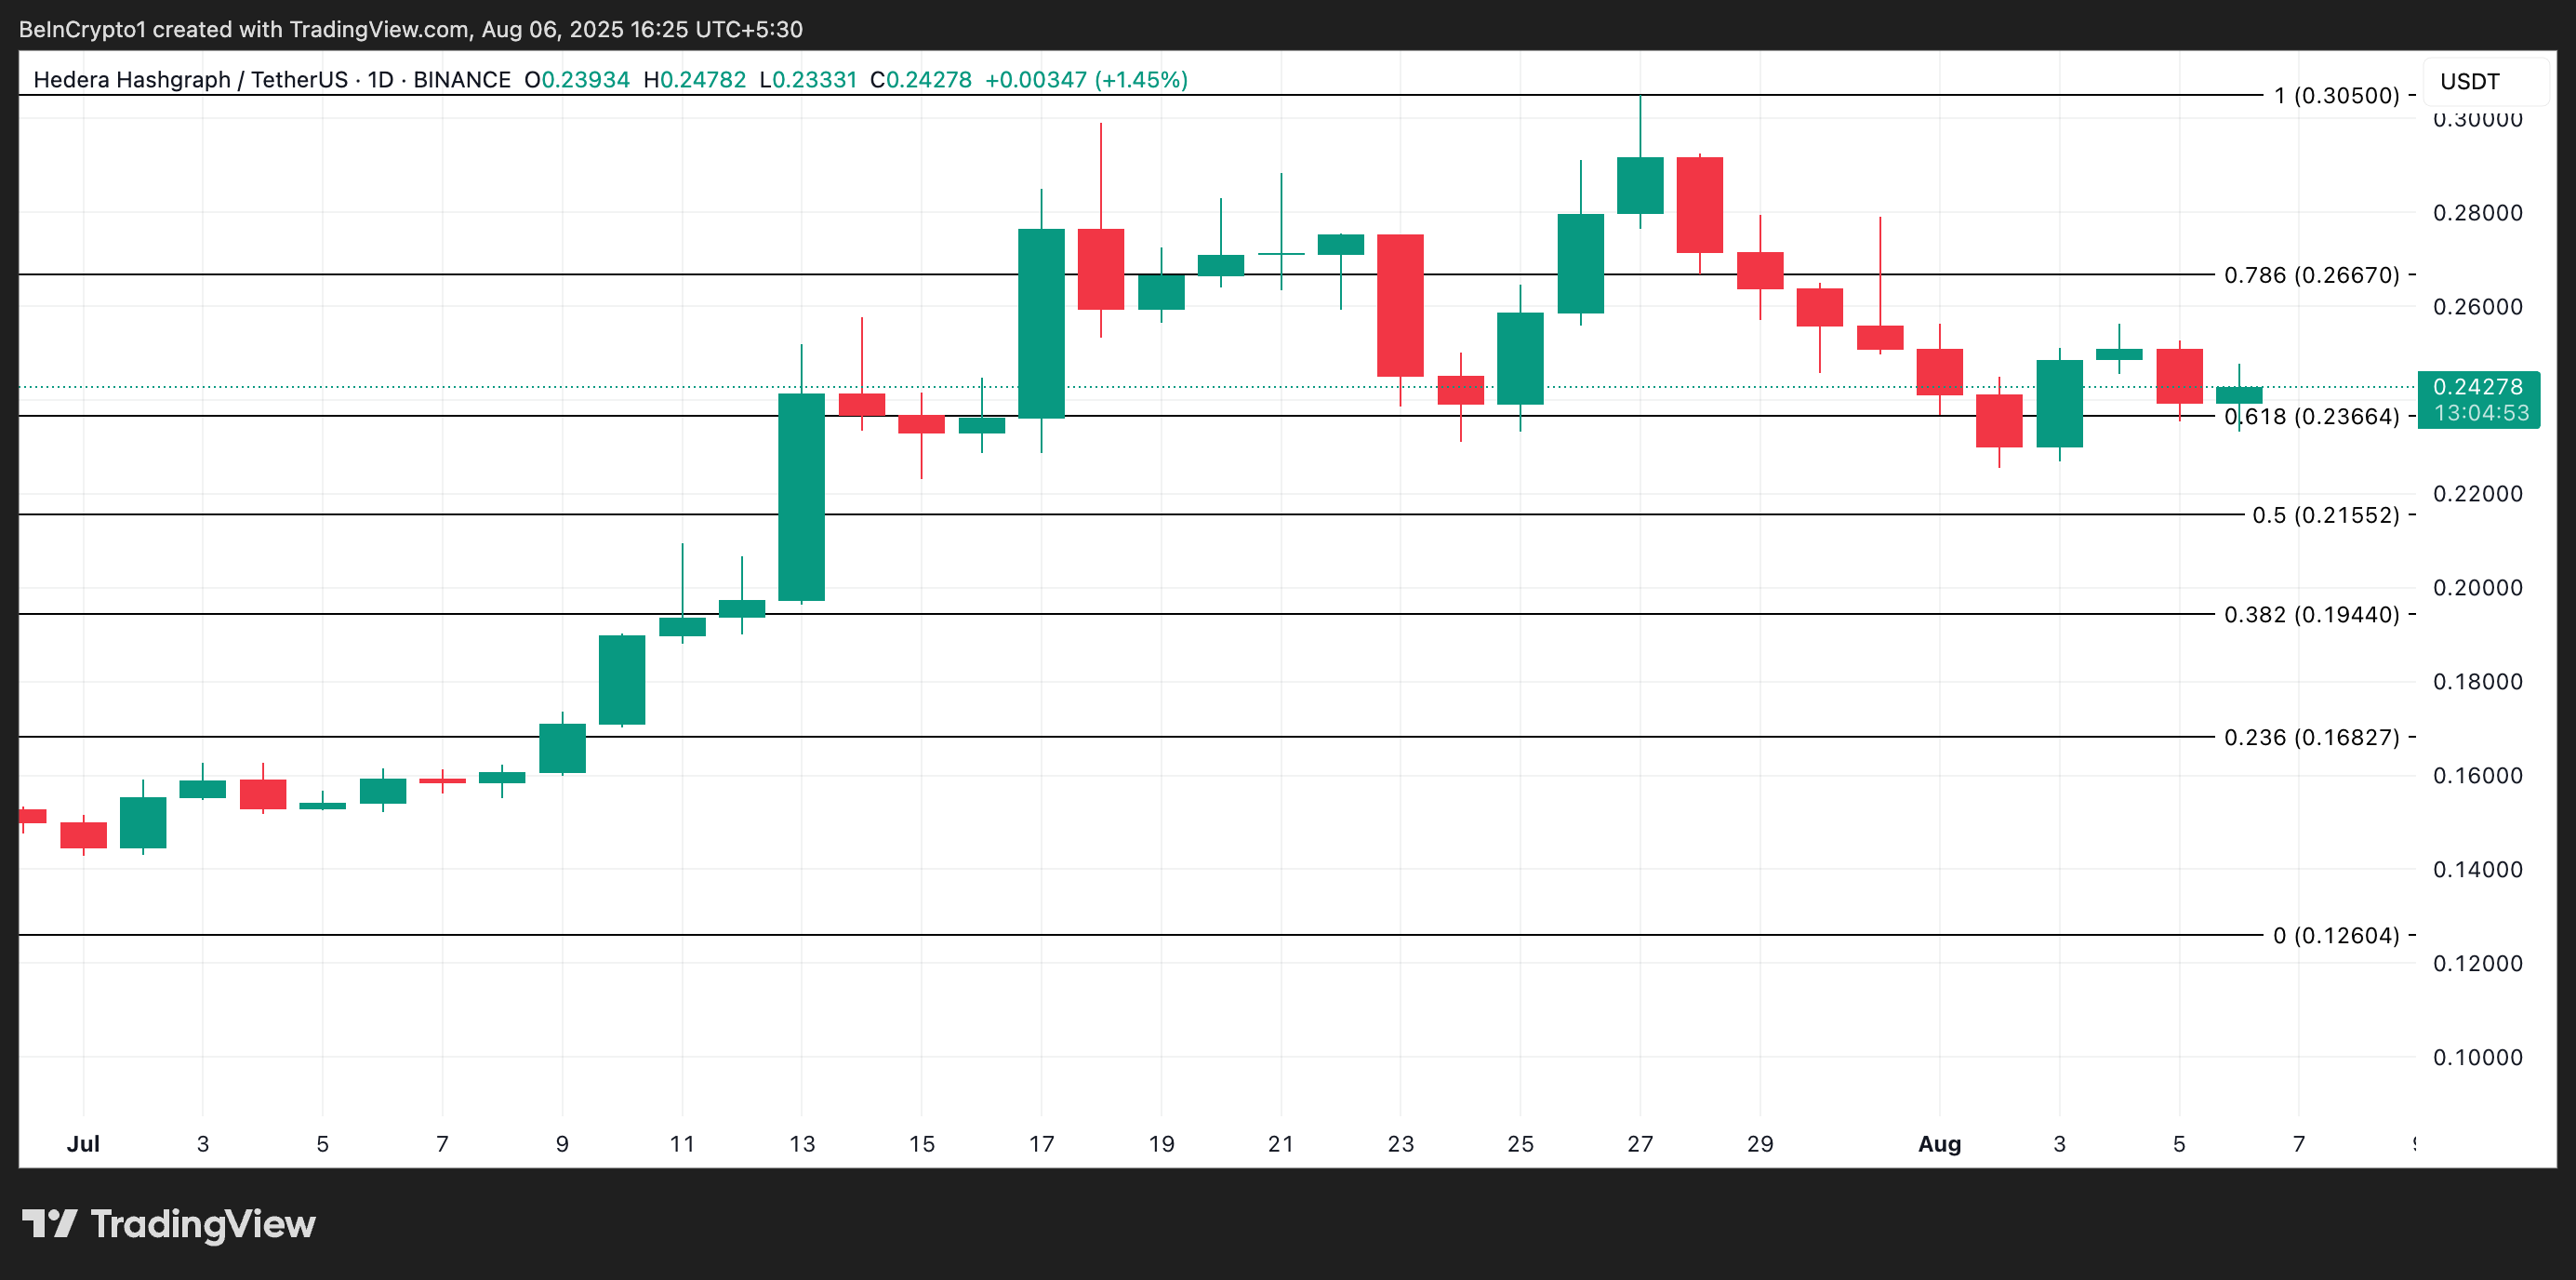
On the other hand, if accumulation resumes, it could drive price gains toward $0.2667.
