🚀 Bullish HBAR Signal Flashes: Is a Mega Breakout Imminent?

HBAR's charts are screaming bullish—but will the market listen?
Technical indicators for Hedera's native token just triggered a rare buy signal, sparking frenzy among crypto traders. The pattern mirrors previous rallies that saw triple-digit gains. Yet skeptics whisper about 'false breakout' PTSD from last quarter's bloodbath.
Key levels to watch:
- Resistance at $0.38 (the make-or-break zone)
- Support holding strong at $0.28
Market makers are playing chicken with retail investors—as usual. One hedge fund analyst quipped: 'These TA patterns work until suddenly they don't, just like your 2% 'high-yield' savings account.'
All eyes now on whether HBAR can punch through its 200-day moving average. Break that, and even the most jaded crypto bros might start believing in unicorns again.
Sustained Outflows Point to Holder Confidence
HBAR has recorded two consecutive weeks of strong negative net flows: –$46.49 million and –$40.85 million. This indicates a clear trend of tokens being pulled off exchanges, typically a bullish sign, reflecting investor confidence and a reduced likelihood of immediate sell pressure.
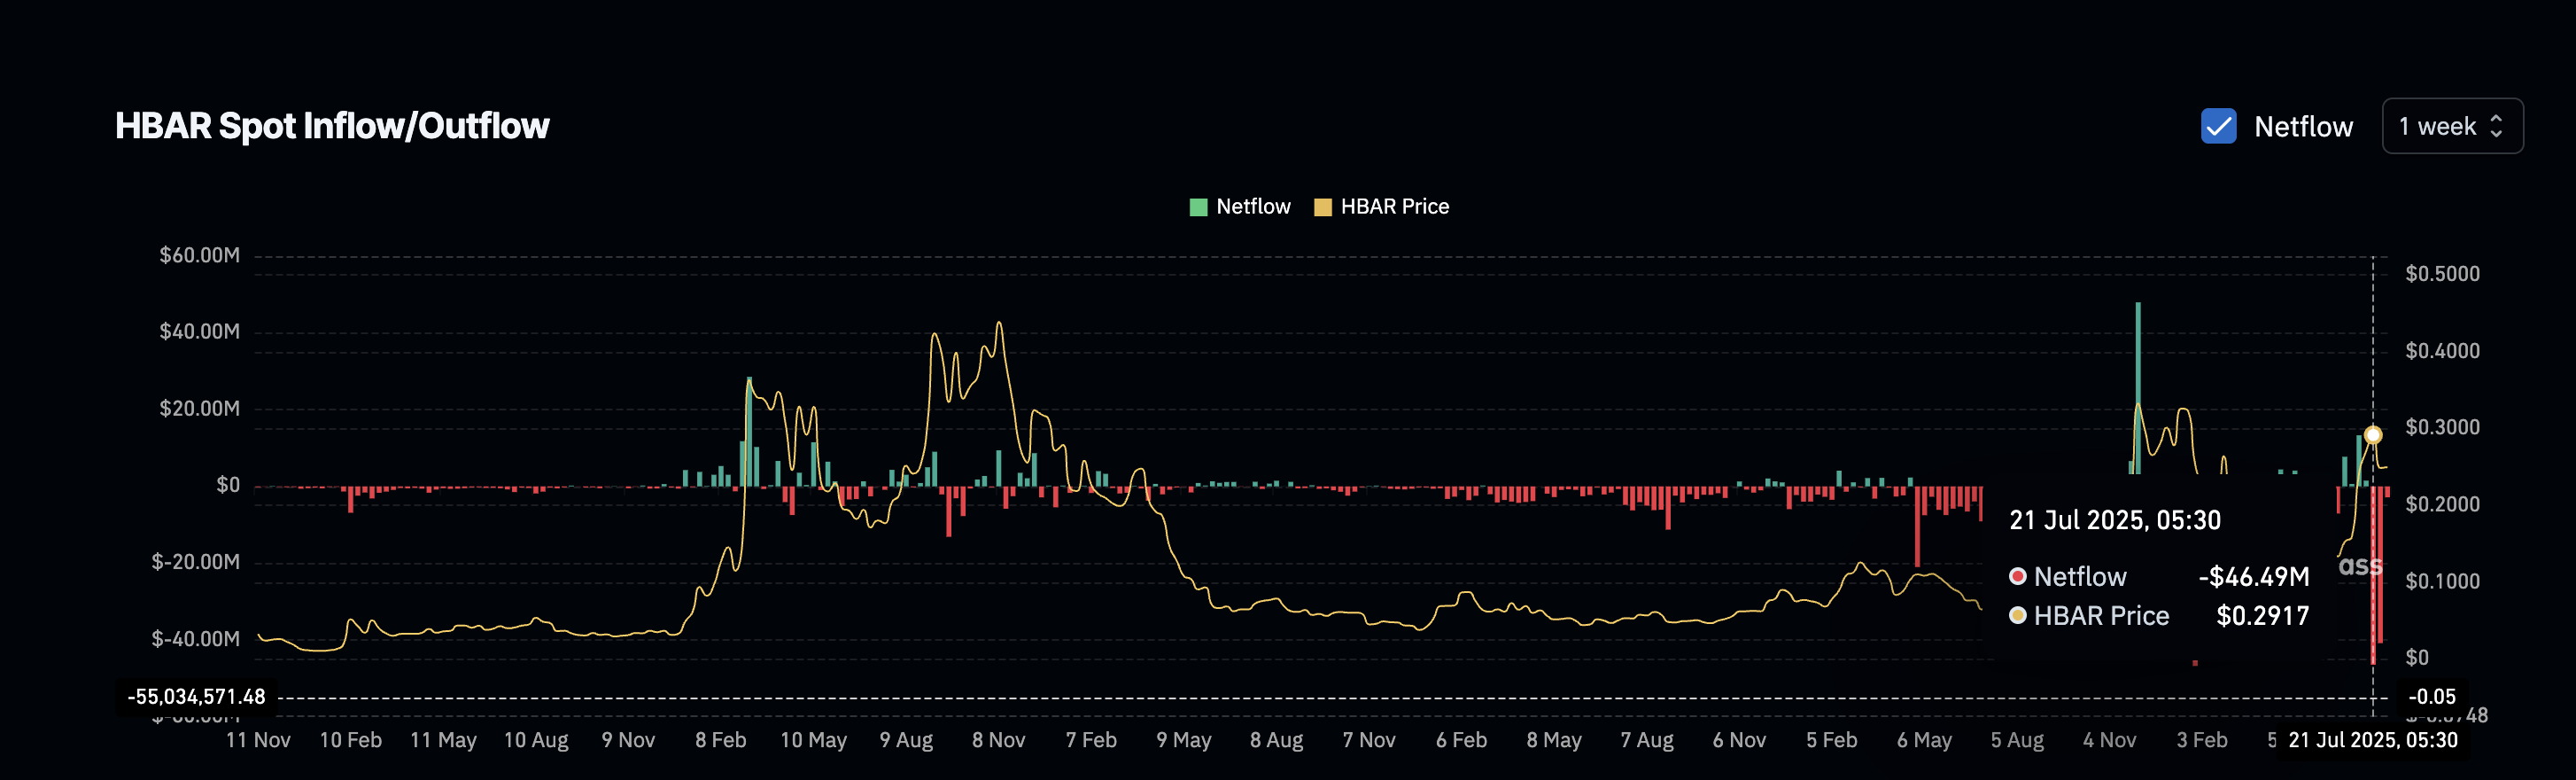
The new week has just started, and traders should keep an eye on the next set of outflows. A third week of negative netflows WOULD further add weight to the accumulation pattern.
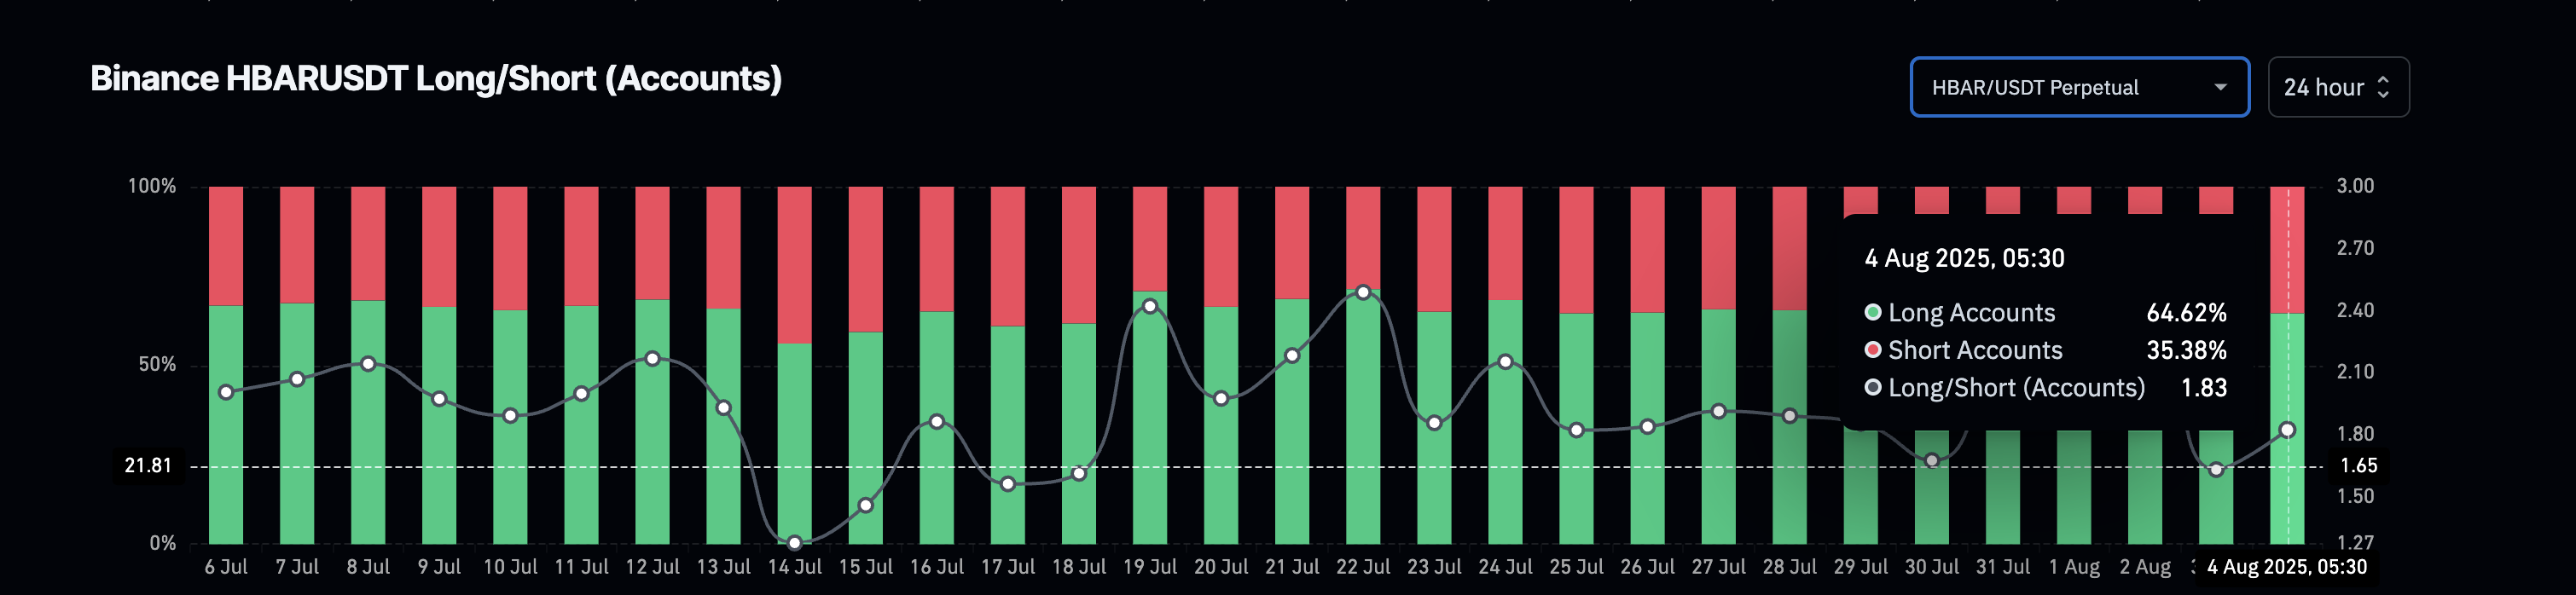
Supporting this is the long-short account ratio from Binance, which sits NEAR 1.83. That means nearly two-thirds of the accounts trading HBAR are positioned long. Unlike long/short volume ratios that track trade sizes, this metric reflects how many traders are betting on price gains. Taken together, the steady outflows and the high long account dominance validate a bullish undercurrent in the market structure.
: Want more token insights like this? Sign up for Editor Harsh Notariya’s Daily crypto Newsletter here.
Short-Term RSI Divergence Suggests Bullish Continuation
To get an early read on momentum, we MOVE to the 4-hour chart, ideal for capturing near-term trend shifts. Between August 1 and August 4, the price formed a marginally lower high ($0.255 to $0.253), but RSI (Relative Strength Index) surged from 42 to 52 over the same period.
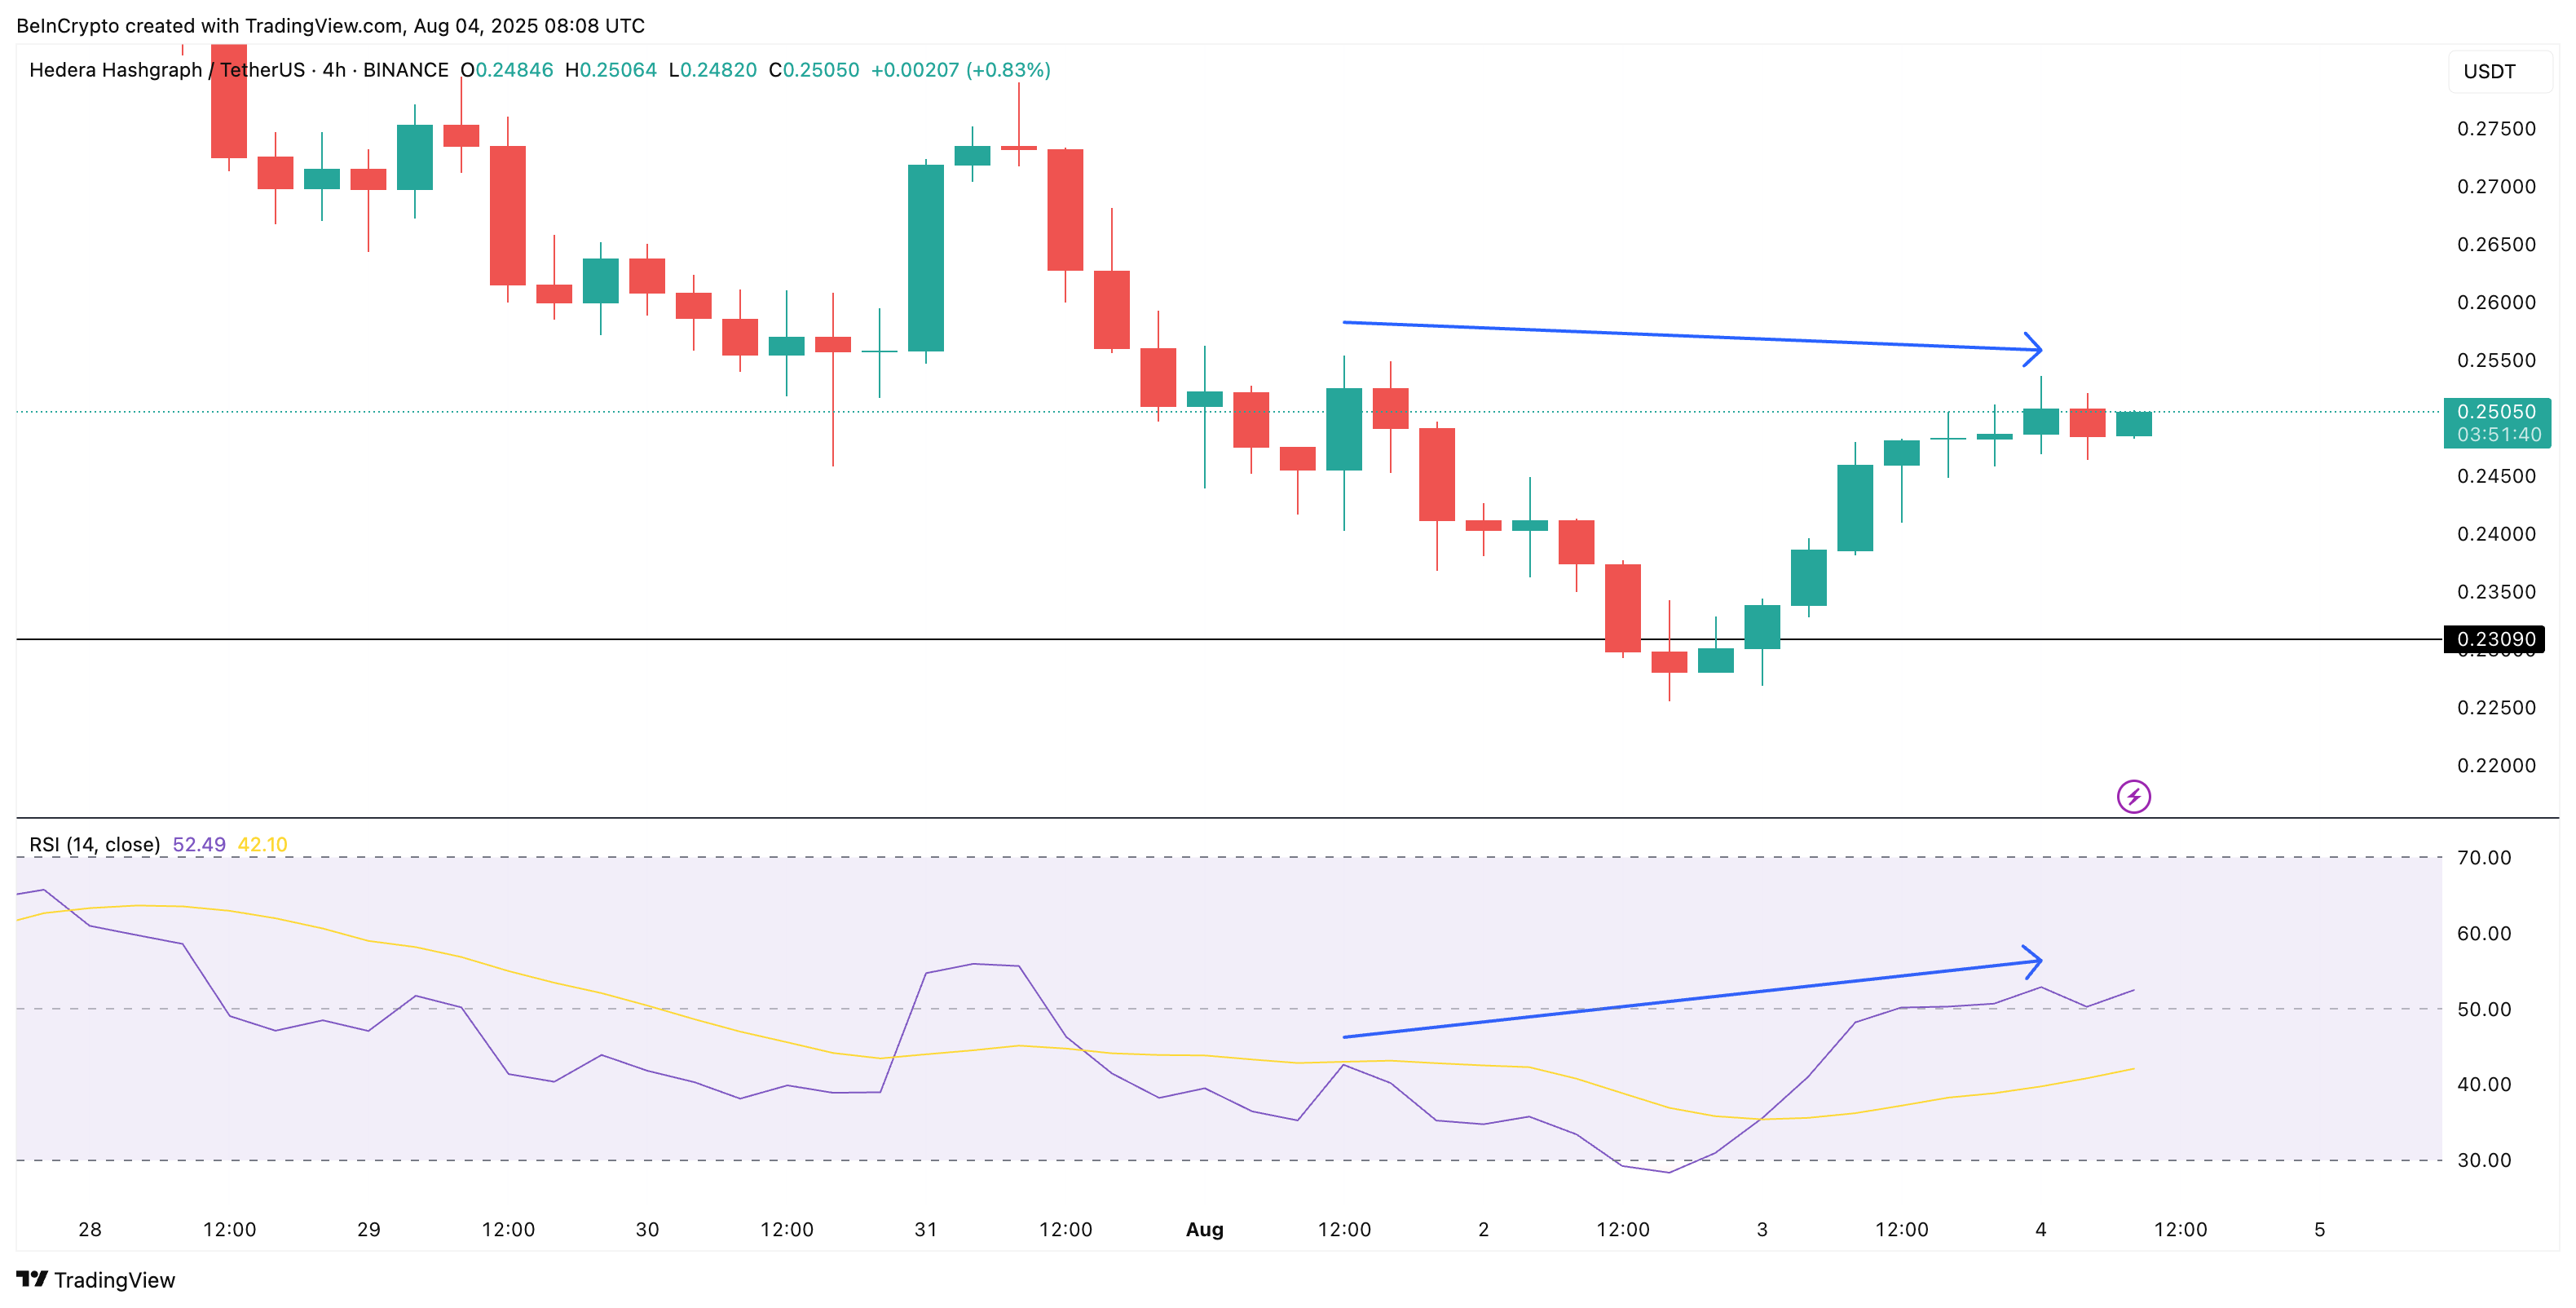
This is a textbook case of hidden bullish divergence, which signals trend continuation, not reversal, in an uptrend. While not a breakout trigger by itself, it strengthens the case for sustained upward movement when paired with net FLOW and positioning data.
The Relative Strength Index (RSI) is a momentum oscillator that measures the speed and change of price movements, helping identify overbought or oversold conditions.
The HBAR Price Pattern Breakout Hinges on Key Fibonacci Levels
HBAR is forming a clean ascending triangle, a bullish continuation pattern. The rising support trendline started in June, while the horizontal resistance levels are being tested repeatedly. A breakout above $0.27 would confirm the pattern, but $0.29 remains the crucial resistance derived from trend-based Fibonacci extension levels (drawn from $0.12 to $0.29 with retracement to $0.23).
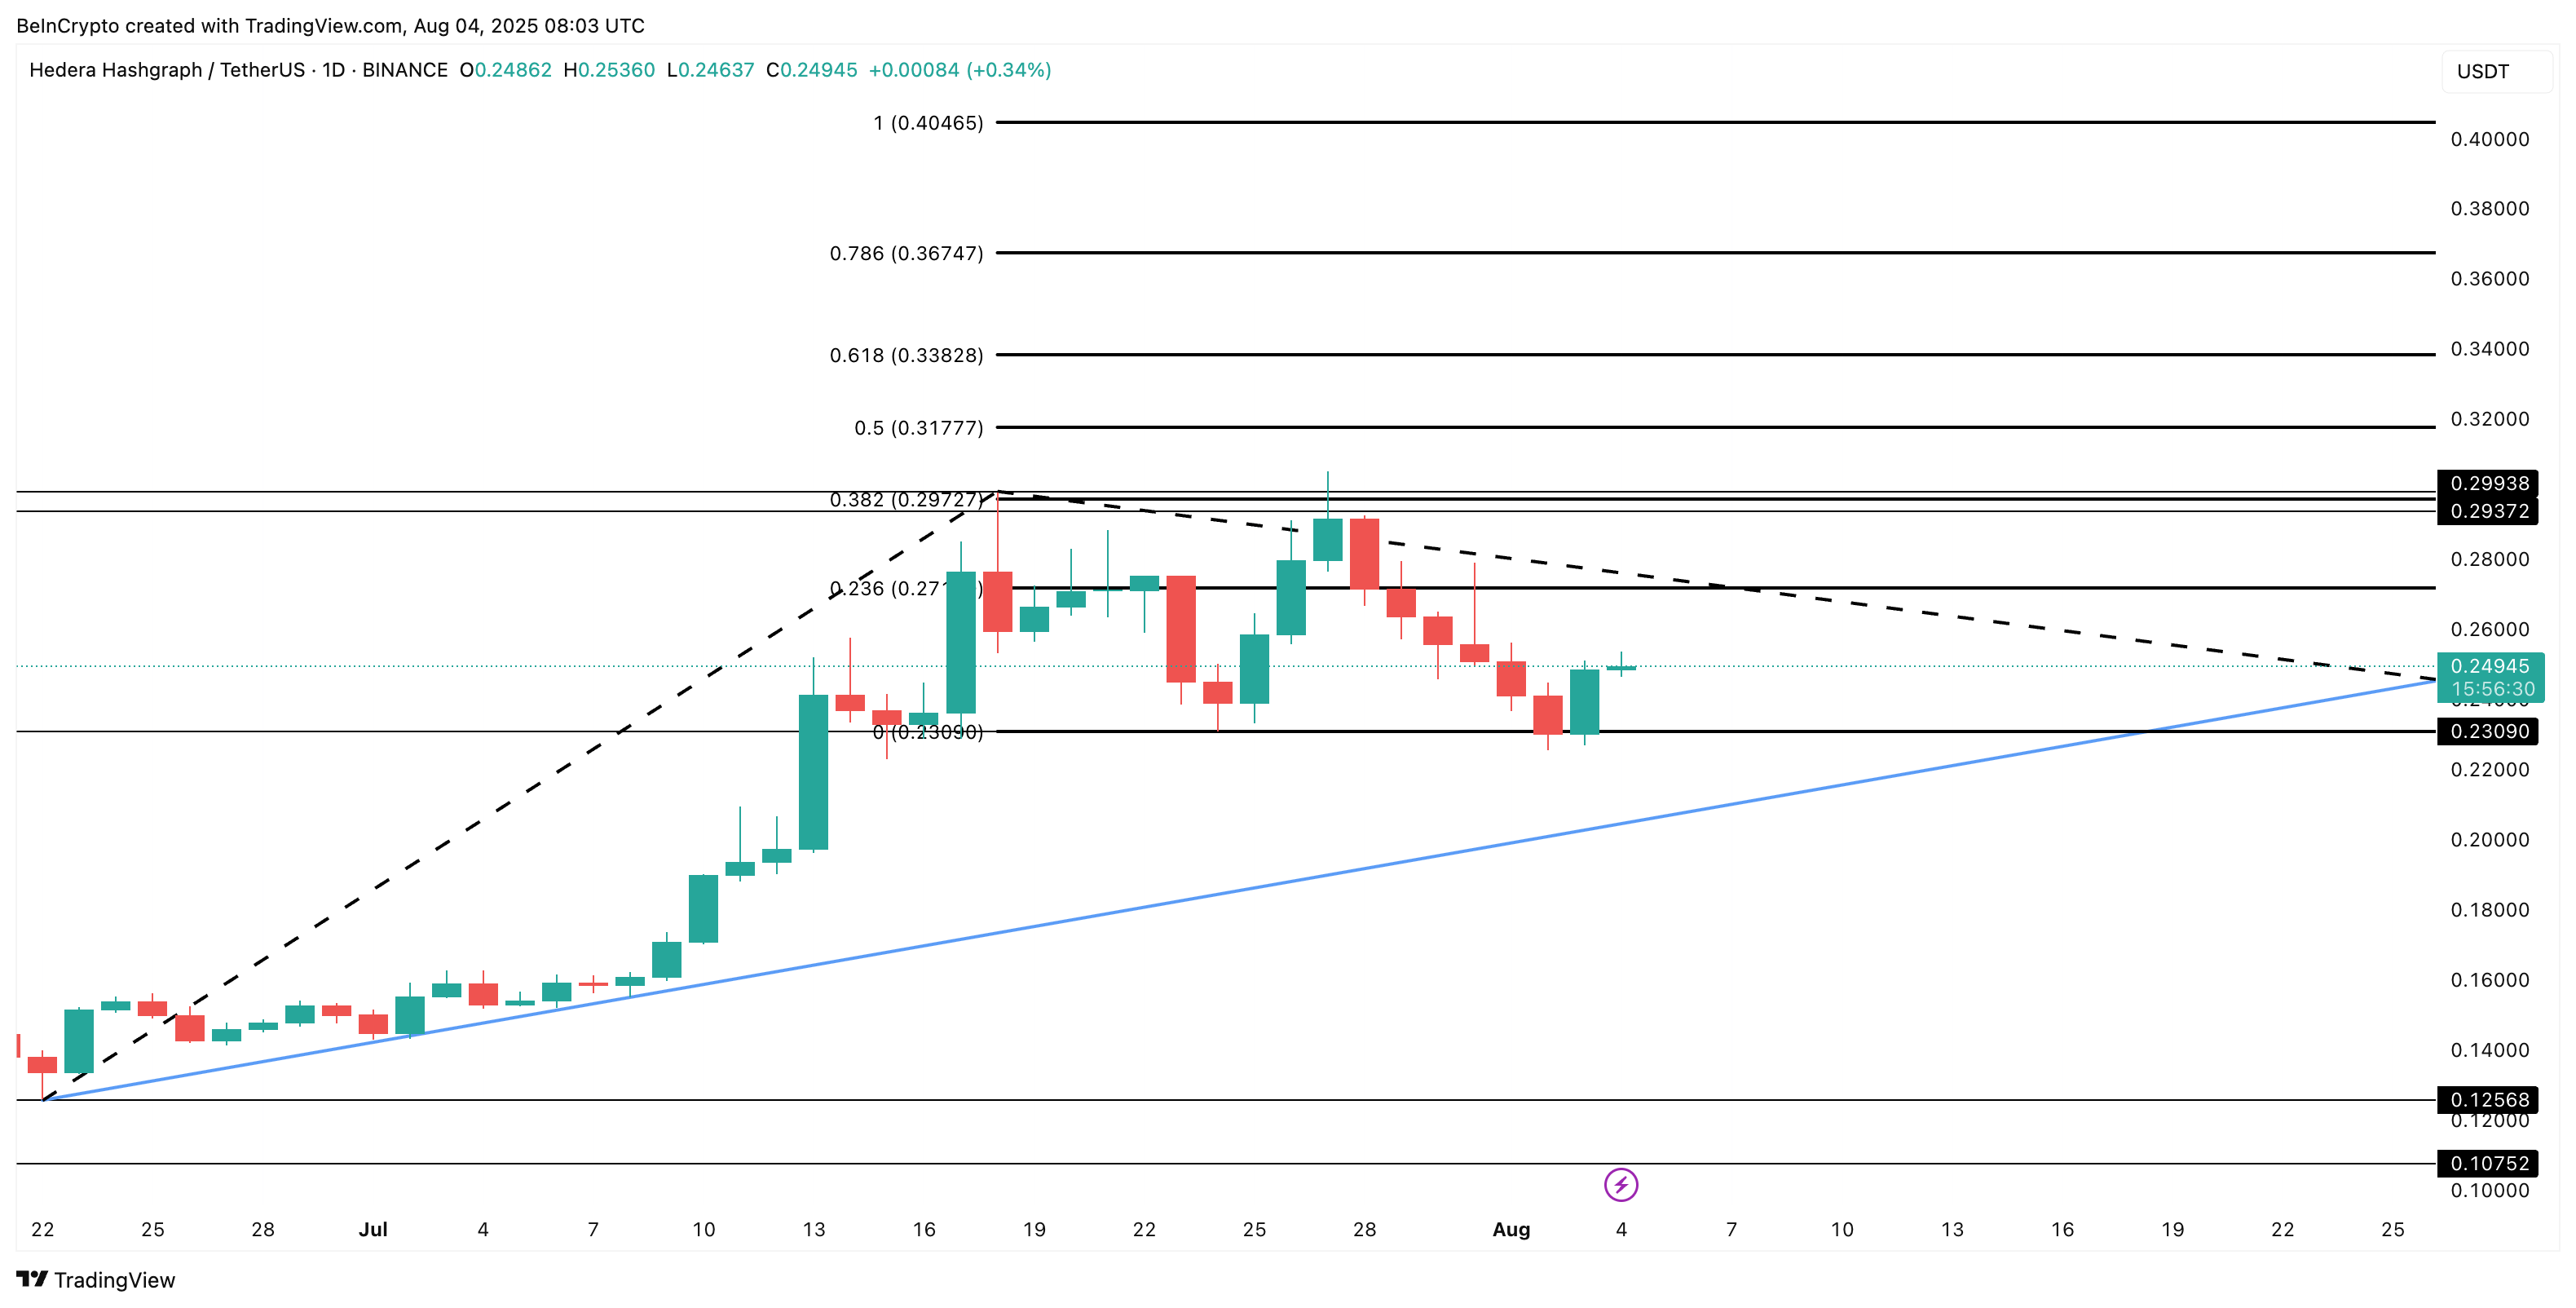
Trend-based Fibonacci extension is a tool traders use to identify potential future support and resistance levels by projecting price moves from a previous trend swing.
If HBAR price breaks $0.29, it could accelerate toward new swing highs. On the downside, a drop below $0.23 would invalidate the short-term bullish thesis, but the broader structure wouldn’t flip bearish unless the HBAR price breaks out of the triangle’s lower trendline.
