


HIP-3: Expensive Tickets, No Moat
 chaincatcher
Author: Mario Chow, IOSG
Ten teams have registered perpetual contract markets on Hyperliquid, locking up roughly $40 million in HYPE. One team accounts for 97.8% of trading volume and just fell 44% in a single month. This article aims to answer what the other nine teams actually got. All data comes from on-chain data, not announcements.
All figures in this article are taken directly from Hyperliquid's public API: perpDexs, metaAndAssetCtxs, daily candleSnapshot covering all 519 registered assets, delegatorSummary, userNonFundingLedgerUpdates, and clearinghouseState{dex}. "30 days" refers to the full UTC calendar days from Aug. 15 to Sep. 13, 2026; "previous 30 days" refers to Jul. 16 to Aug. 14, 2026; "7 days" refers to Sep. 7 to 13, 2026. HYPE is calculated at $79.73. Routing data in Section 7 comes from Flowscan, because builder code volume cannot be aggregated from the public API.
Summary
HIP-3 is once again a minority on Hyperliquid. Over the past 30 days, builder-deployed markets accounted for 25.8% of perpetual contract volume, down from 57.1% the previous month. This change is mainly driven by the denominator: core volume more than doubled, while HIP-3 itself is declining.
The leader is shrinking. Trade[XYZ] posted $64.6 billion in volume over the past 30 days, down 44.2% month-over-month, with the 7-day average falling from a peak of $5.36 billion per day in early August to $2.01 billion per day. About half of this decline is attributable to falling storage and AI sector volume in real markets, and the other half to the platform itself. Since Aug. 18, it has not outperformed the core order book on any single day.
Entropy (io) led in a contested market for a full week, then gave it back. Its market share on Nebius showed a trajectory of 8.7%, 53.1%, and 20.4% over three weeks, and its own volume declined for three consecutive weeks. The contrarian signal lies in open interest: open interest rose 37% against the trend to $51.4 million.
Settlement assets remain the lifeline, and the record is still 6 to 6. All platforms settling in non-USDC stablecoins have stopped trading; those still active all use USDC.
Asset listings cannot be sustained. At the current auction floor price, one asset costs about $39,900, and buying all of Paragon's listed markets would cost about $1.04 million, equivalent to two weeks of fee income for Trade[XYZ].
No one is competing on price. All equity platforms run Growth Mode with deployerFeeScale = 1.0, with Trade[XYZ]'s effective rate at 0.427 bp and Entropy at 0.400 bp. All platforms other than the leader, whether alive or dead, have collectively earned only $747,000 in deployer fees over their lifetimes.
I. The Ten Deployers Appear
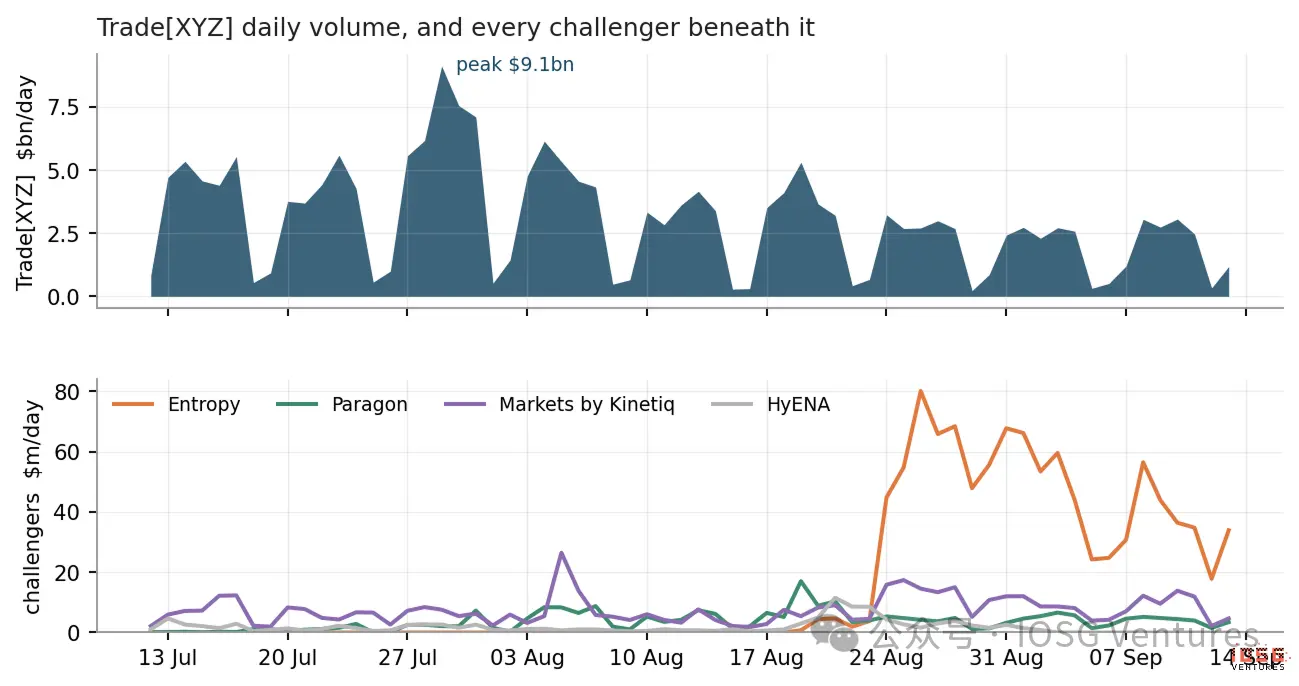
▲ Daily volume of Trade[XYZ] and all challengers below it. The vertical axis scales of the two charts differ by about 100 times.
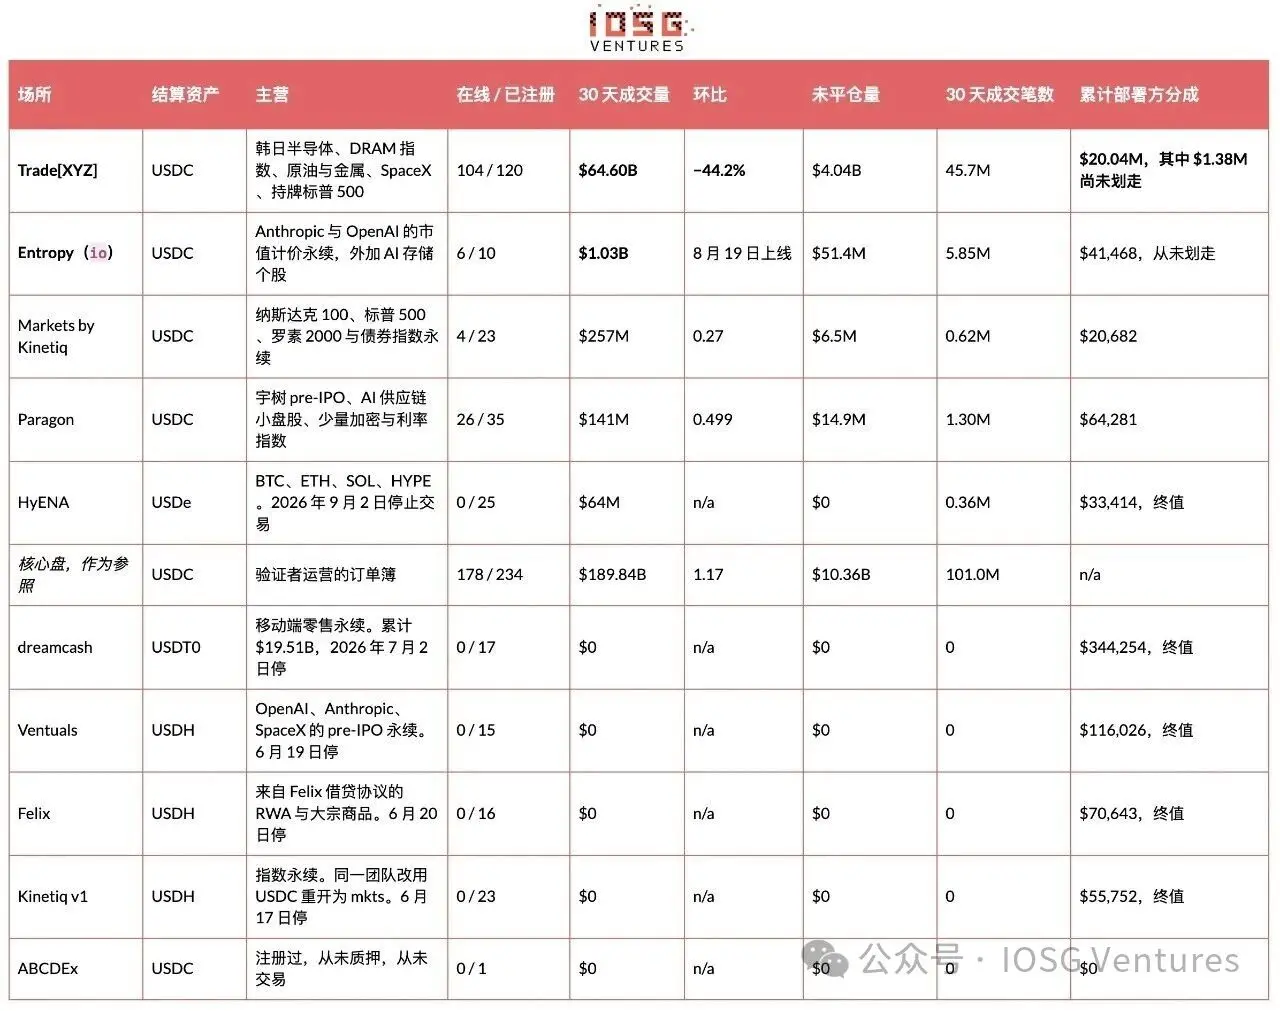 "Trade count" is the sum of the n field in daily candles within the window. The public API cannot provide the number of independent traders.
Historically, only ten teams have registered perpetual contract DEXs, and an eleventh has not yet appeared. Four are trading, five have stopped, and one never opened. Trade[XYZ] accounted for 97.8% of HIP-3 volume over the past 30 days and 97.6% over the past 7 days.
The challengers can be summarized in a few sentences. Entropy generated $1.03 billion in volume in 26 days, has six listed markets, and relies on its own oracle rather than an asset list. It is the only platform that has truly led in a market where it simultaneously quoted the leader. Paragon is the only challenger whose order book looks like an order book, with 26 listed markets and an open tail distribution; it still grew 49.9% for the month even when Trade[XYZ] entered five of its targets at once. Kinetiq's Markets bought 23 targets, with 95% of volume concentrated in two index perpetuals. HyENA is finished: markets delisted, open interest at zero, and lifetime earnings of $33,414.
II. HIP-3's Market Share and Why It Is Easily Misread
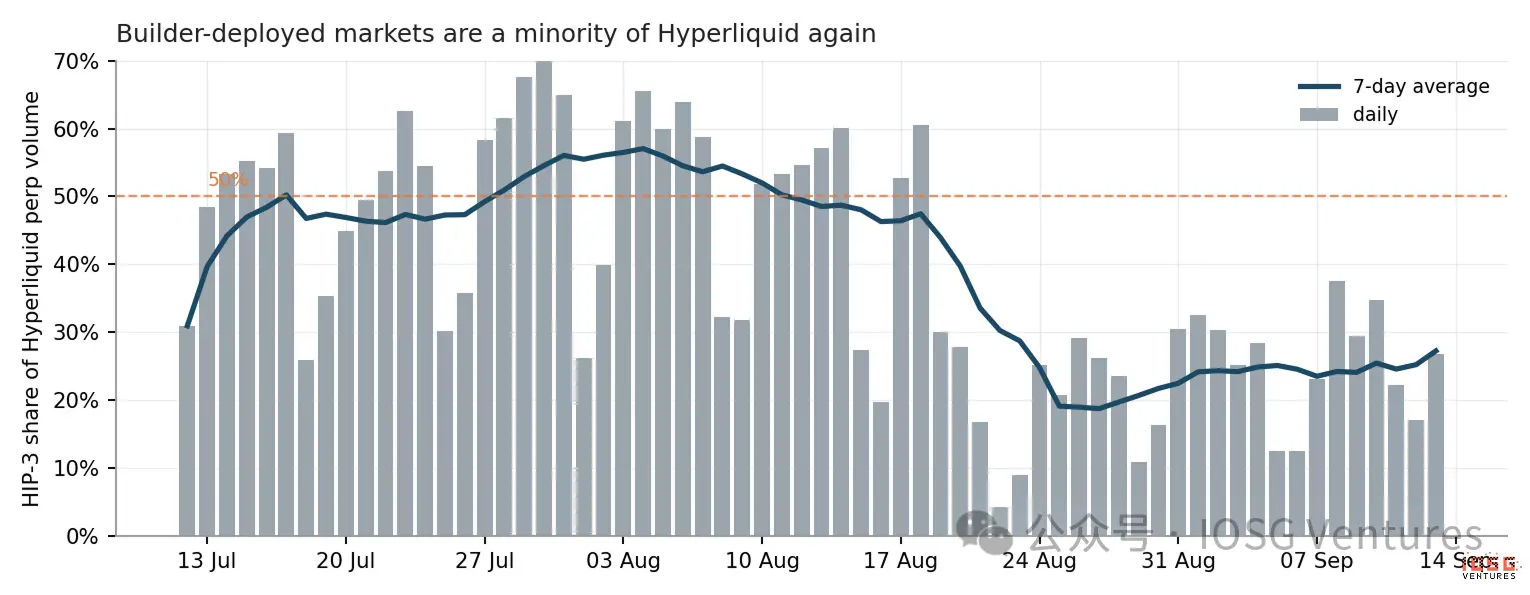
▲ HIP-3's share of Hyperliquid perpetual contract volume, calculated daily.
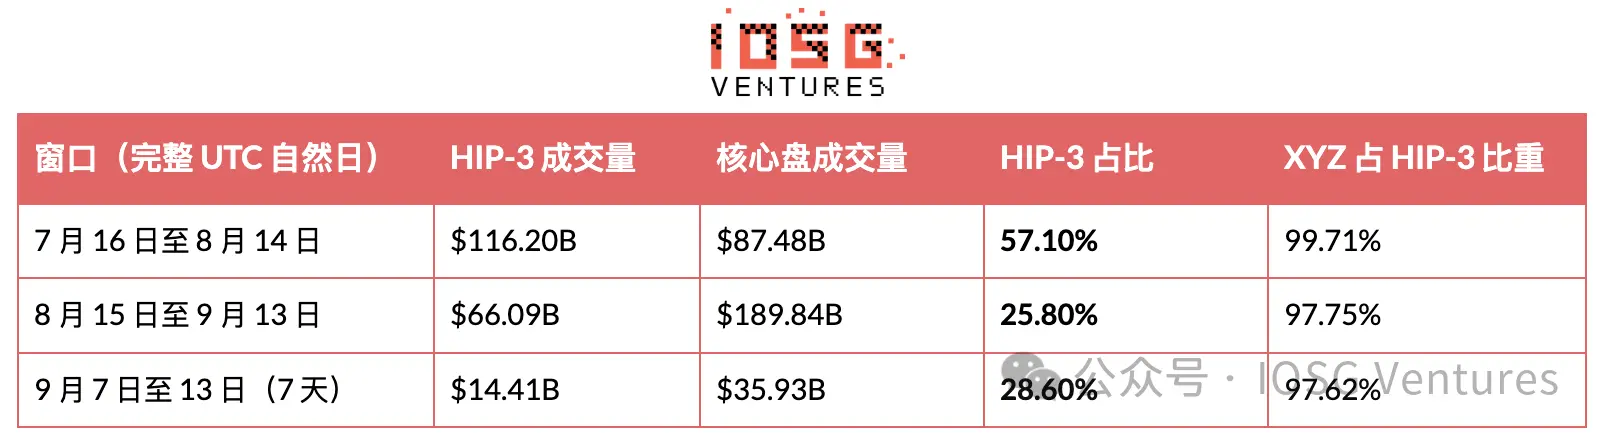
The 7-day average broke above 50% in mid-July, approached a peak of nearly 57% in early August, then fell below 30% and has not recovered since Aug. 20. On Aug. 18, a single builder's volume surpassed Hyperliquid's entire validator set. It has not been achieved since.
This ratio actually reflects its denominator. The numerator is the equity order book, the denominator is the crypto order book, and the volatile side is on the crypto end. 57% was read during a quiet period in crypto, while 26% was read when the same equity order book encountered market conditions, during which core perpetual volume grew 117%. The most recent seven-day share even rebounded to 28.6%, while Trade[XYZ] continued to shrink. Before citing any HIP-3 market share, one must first clarify the state of crypto at that time. What really matters is absolute volume, and absolute volume is deteriorating. Trade[XYZ] posted $64.6 billion in volume over the past 30 days, down 44.2% from the previous month, with the 7-day average falling from $5.36 billion per day in early August to $2.01 billion per day, and its own order book pulled back 62%. The largest market, SK Hynix, fell to $8.50 billion. Both legs of the market share decline are real. The next section will show that the HIP-3 leg is mostly not a competition problem. The main cause of the volume decline is the storage sector turning calm, not market share loss. Interpreting the 44% drop directly as "the leader is losing" is the simplest explanation, but the data does not support it. The verification method is straightforward: if the decline came from competition, we should see the target assets themselves trading as usual, with only Trade[XYZ]'s captured portion decreasing. What actually happened is that the target assets themselves have calmed down.
There was no sell-off. Using the early August volume peak as the baseline, prices in every major market in today's order book are higher.
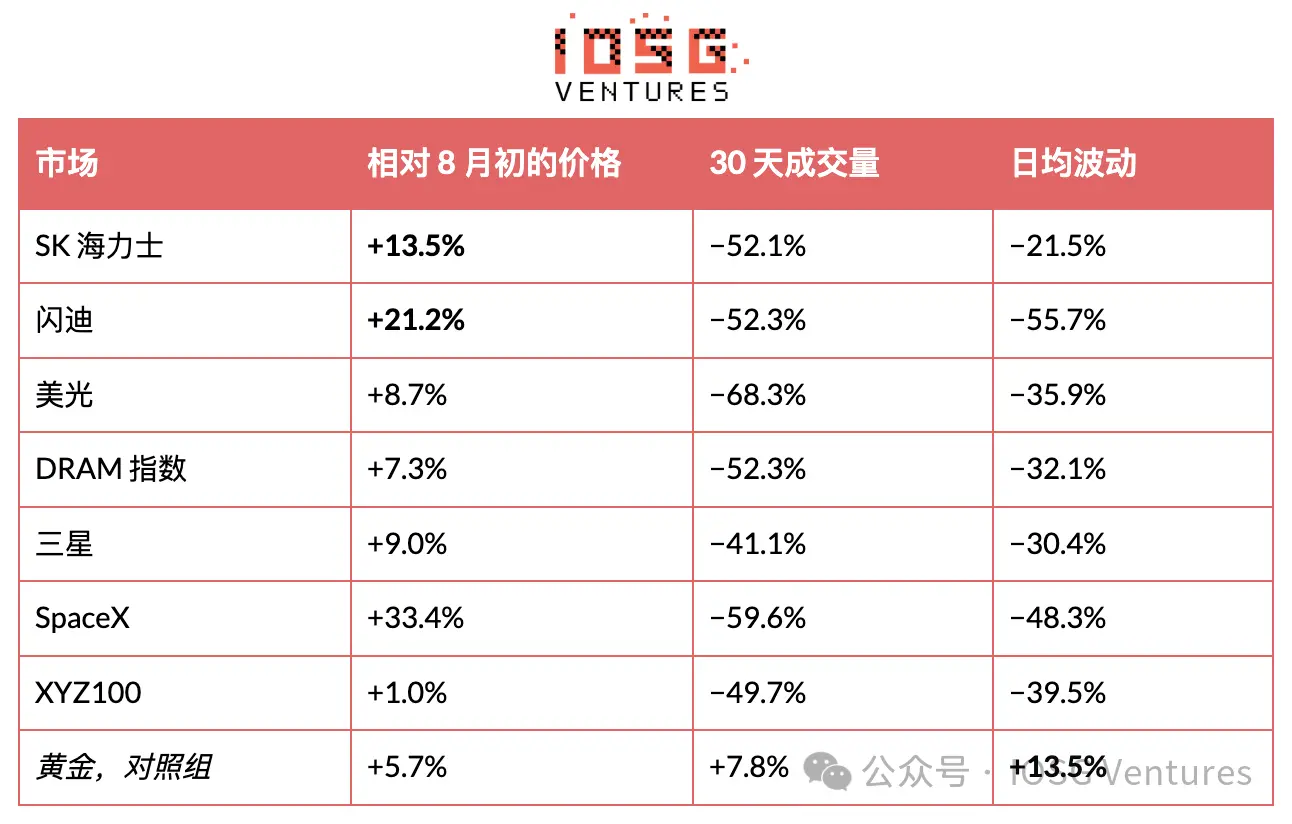
What really collapsed is the daily volatility these targets can exhibit, and the platform's volume almost follows in lockstep. 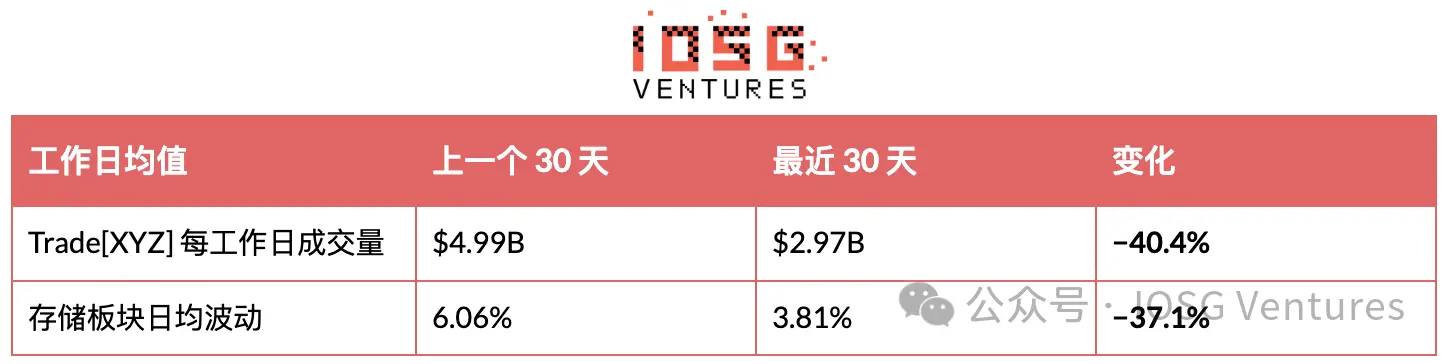
The above is based on weekday metrics, because stock markets are closed on weekends while Trade[XYZ] continues to trade, and including weekends would significantly exaggerate this relationship. Looking only at weekdays, the correlation coefficient between average daily volatility in the storage sector and the platform's daily volume is +0.47, with a sample of 45 days. Gold is a natural control group: it is the only major market whose intraday volatility rose this month, and its volume rose accordingly. Silver is the exception that does not fit this pattern.
However, volatility is only a proxy variable. A more direct test is to compare actual stock trading volume for the same nine targets, and the answer is: traditional markets can only explain about half.
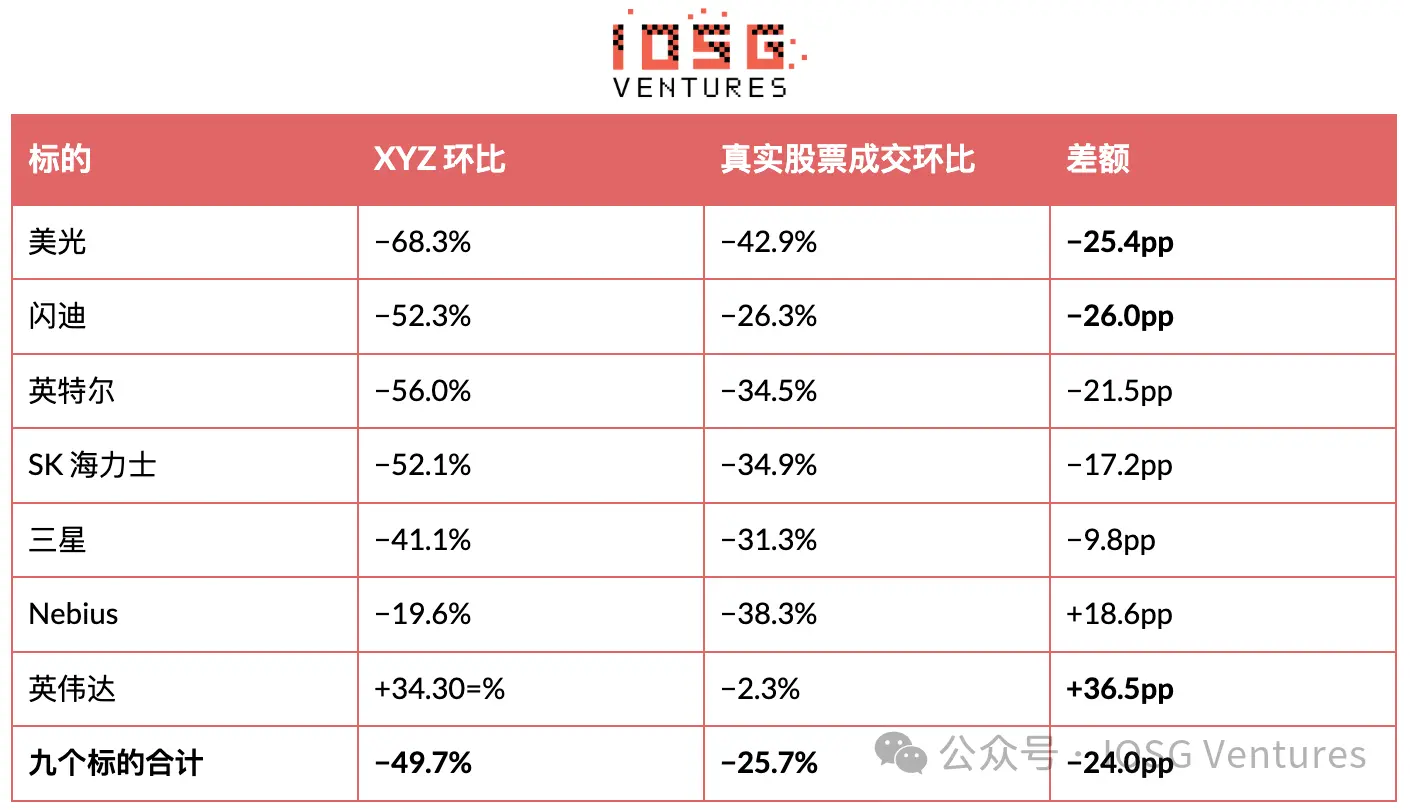
Actual volume in the storage and AI sector did collapse by 25.7%, and that half is real. But XYZ fell 49.7%, almost twice as much. The extra 24 percentage points were not provided by the industry.
Moreover, the largest gaps are precisely in its core: SanDisk −26.0 percentage points, Micron −25.4 percentage points, Intel −21.5 percentage points, SK Hynix −17.2 percentage points. It actually outperformed real markets on Nvidia (+36.5 percentage points) and Nebius (+18.6 percentage points), but those two order books are relatively small.
Competition also cannot explain this gap. Entropy's total 30-day volume on SanDisk was $523 million, while XYZ's own SanDisk order book fell by $6.14 billion; challengers could only capture about 8% of that.
The rest resembles capital rotation. Over the same period, core perpetual volume on Hyperliquid grew 117%, while HIP-3 declined, and total volume on both sides still grew 26%. Capital did not leave Hyperliquid; it simply rotated from equity order books back to crypto order books.
Scale anchor. In the same 30 days, these nine targets traded a combined $2.0047 trillion on their respective exchanges, while XYZ traded $23.5 billion on them, or 1.2%. XYZ's total volume of $64.6 billion across all 104 markets is only 3.2% of the actual trading volume of these nine stocks. The highest penetration is SK Hynix at 9.1%, and the lowest is Broadcom at 0.1%. This curve itself illustrates the nature of this business: assets inaccessible to crypto-native traders have high penetration, while widely accessible US large caps have low penetration.
Therefore, this decline is caused by two factors: about half is sector beta, and the other half is its own. The calculation in Section 6 only considers actual volume, regardless of where the volume comes from, so fee income is unaffected. However, these two halves must be viewed separately: the sector half will come back, but the platform's own half may not.
III. The Reshuffle and the Only Predictive Variable
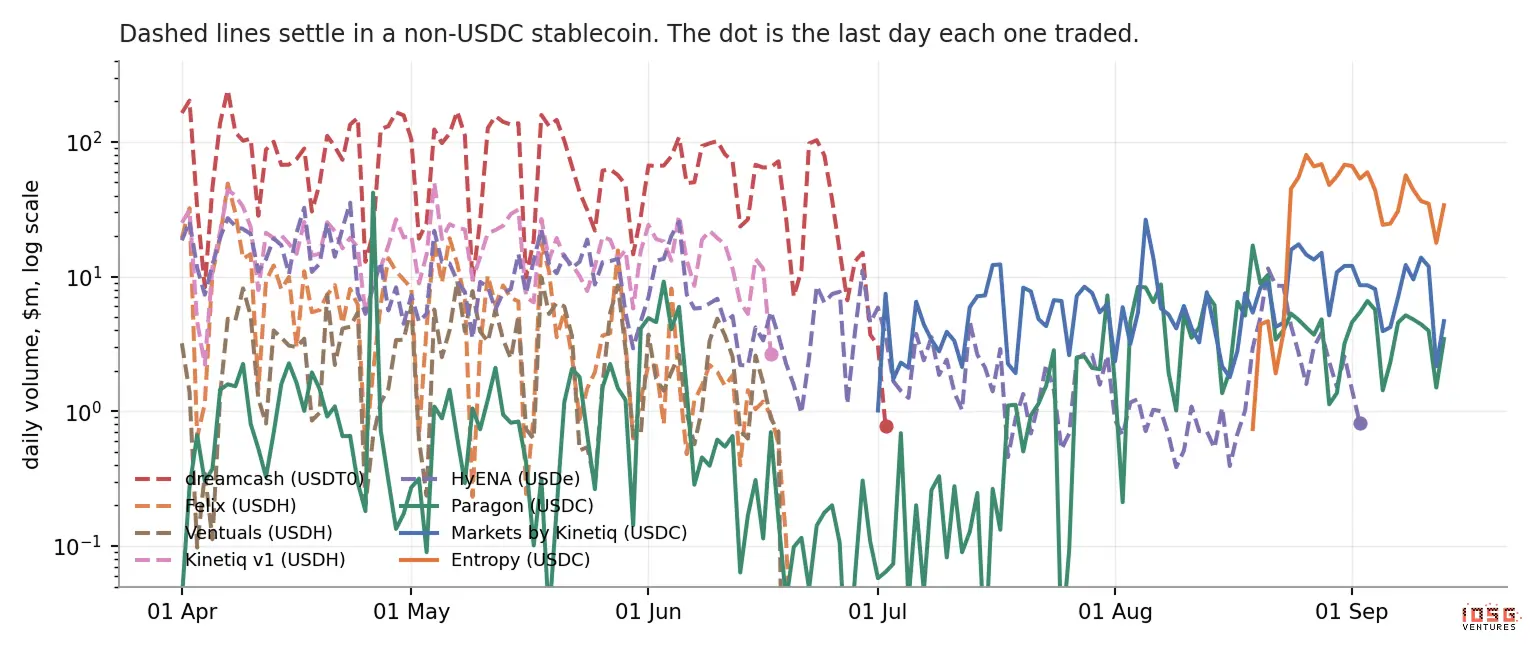 ▲ Daily volume of each HIP-3 platform, logarithmic scale. Dashed lines represent platforms settling in non-USDC stablecoins, and dots indicate their last day with trading. As of today, six platforms have stopped trading, and the variable that distinguishes them is not asset selection, team quality, or historical volume, but the stablecoin used for settlement.
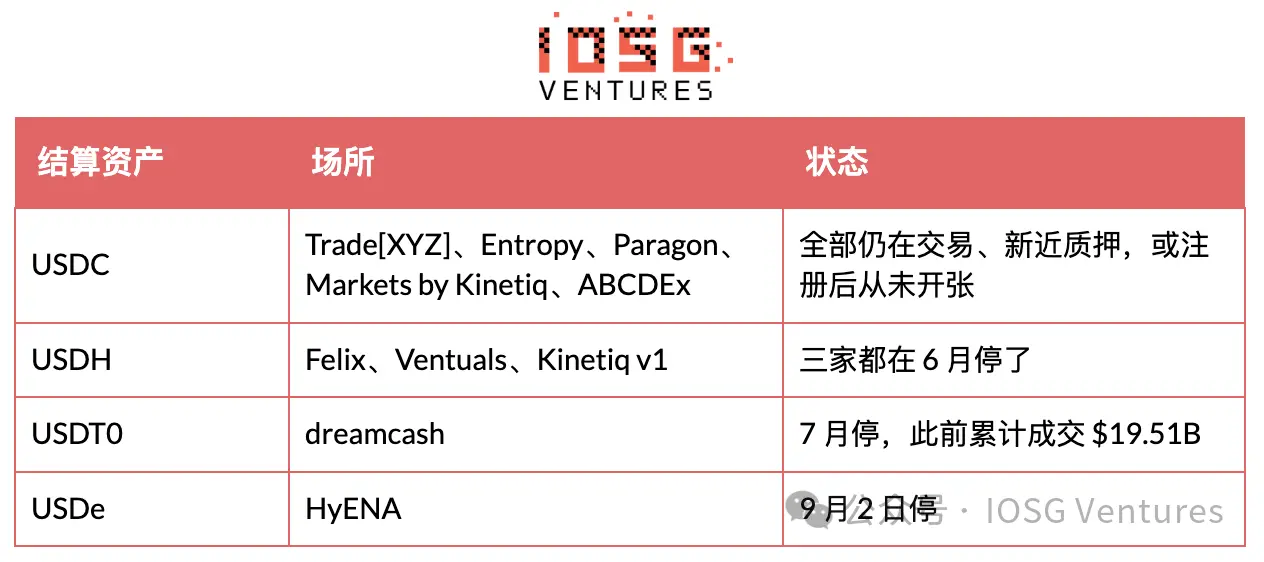 The mechanism itself is quite simple: traders must first convert to a specific stablecoin before placing their first order, and they are unwilling to do so. Felix is the clearest example. The small fee discount supporting USDH was wiped out as soon as Growth Mode launched, leaving this settlement asset with nothing but friction.
Kinetiq can serve as a controlled experiment. The only operator that survived after shutting down did so by eliminating the USDH platform and reopening the same index products on USDC. Historical volume cannot predict anything: dreamcash had $19.51 billion, more than the entire June batch combined, yet still ceased operations. Entropy entered in August with more capital than any previous entrant and chose USDC without hesitation. What really determines the settlement asset is not what it is itself. Interpreting USDC's sweep as a protocol arrangement is natural, but Hyperliquid's own documentation says otherwise. Under Aligned Quote Assets v2 (launched on USDC in late August, with Coinbase as reserve deployer and Circle as technical deployer), approximately 90% of adjusted reserve yield on USDC on Hyperliquid is allocated to the protocol, entering the Assistance Fund. Interest is calculated on a 30-day basis and paid on the 8th day after each period ends, so the first payment will not arrive until early October, and not a cent has been received yet.
AQAv2 explicitly does not favor HIP-3. The documentation clearly states: no preferential treatment in trading fees or volume, and other valuable assets continue to receive support on HIP-3 perpetuals. Fee preferences belong to AQAv1, which provides lower taker rates, higher maker rebates, and higher volume counts for collateral assets on the platform, and USDC is not included in AQAv1 and structurally cannot enter, because that tier requires the stablecoin to be exclusive to Hyperliquid. The real privileges AQAv2 provides point to event contracts and validator-operated perpetuals, and must await subsequent upgrades; this article does not measure them.
Therefore, the settlement asset matter is determined by liquidity and one-time corporate-level actions, not fee design. USDH ceased operations on July 17, 2026, with holders redeemed 1:1 into USDC, and Coinbase acquired its brand assets while becoming a reserve deployer for USDC. Today, among stablecoin supply on Hyperliquid, USDC accounts for 98.3%, USDT for 1.2%, and the remnants of feUSD, USDe, and USDH are each about one-thousandth. Platforms settling in other assets were not harmed on fees. They were asking their traders to leave the only deep pool.
Estimating the scale of AQAv2, on the premise that officials have never disclosed any figures. USDC on Hyperliquid is $6.77 billion, SOFR is about 3.6%, and with a 90% revenue share, this item roughly points to about $200 million per year. Third-party estimates based on a $5 billion base fall between $135 million and $160 million. What cannot be determined externally is the cost adjustment in the AQA rate, which is reported by validator oracles and whose level is not public, so every number here is an estimate rather than a measurement.
HyENA fills the second mechanism. Because it listed crypto assets, it was excluded from Growth Mode, so it quoted about 5 basis points on the same underlying, while its core markets quoted about 3 basis points, resulting in poorer trading quality. It spent about $880,000 on asset slots and earned a lifetime total of $33,414.
Ceasing operations does not mean exiting. HyENA has delisted all 25 markets and open interest has dropped to zero, but its stake remains at 508,915 HYPE, about $40.6 million, and no withdrawal has been initiated for twelve days. Felix and dreamcash have fully withdrawn their stakes, with current readings at zero, while Ventuals has only 7,967 left. A platform that has delisted all markets yet retains $40 million in staked assets on-chain is either liquidating slowly or occupying this deployment slot for other purposes.
Ventuals' cause of death deserves separate discussion, because the next generation of products is designed around this problem. Insufficient liquidity is only a symptom; the mechanism lies in the funding rate: pre-IPO perpetuals did not converge to the anchor price, and the funding rate once spiked to an annualized rate of about 8,700%. Regardless of whether the mark price was correct, longs would be liquidated. Entropy caps the annualized funding rate at about 10% and settles using the TWAP of its mark price, rather than chasing external prices. Its contract design can be seen as a checklist aimed at the specific causes of Ventuals' death. When examining any pre-IPO market, check the funding rate and settlement design first, then the asset list.
IV. Trade[XYZ]'s Market Composition and Why It Does Not List OpenAI
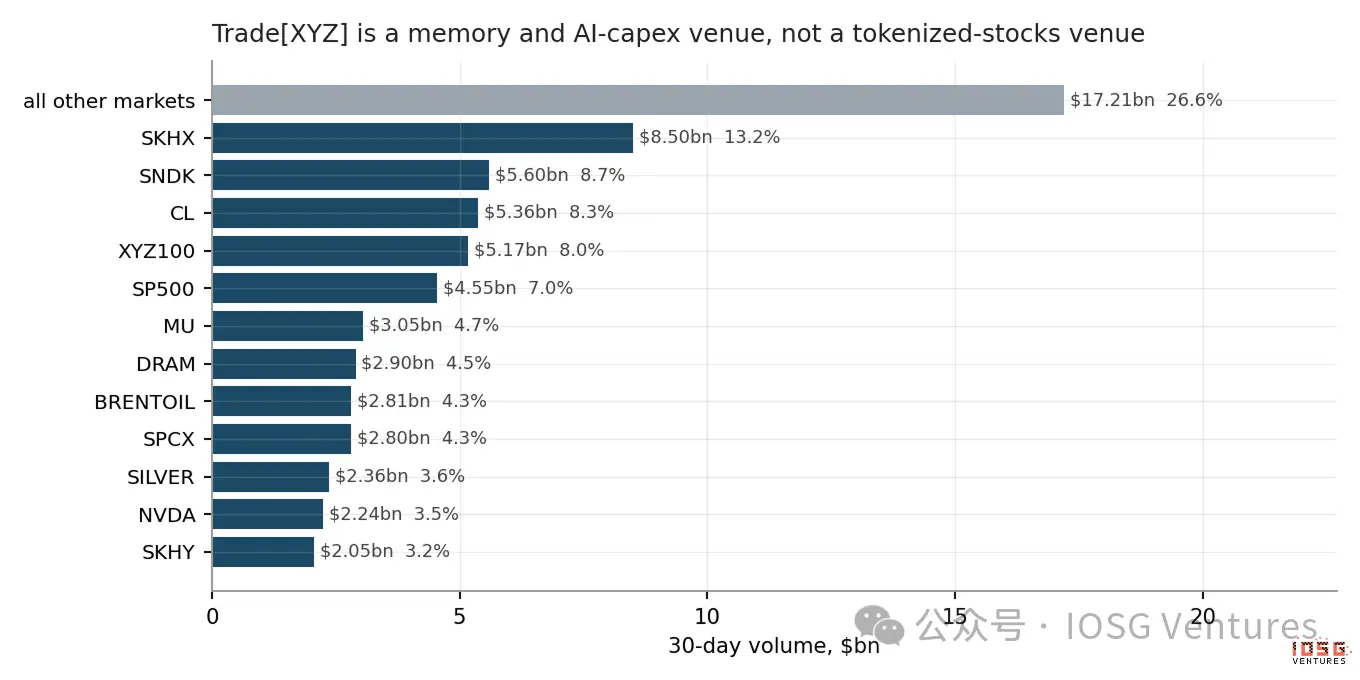 ▲ Trade[XYZ]'s largest markets by volume over the past 30 days.
The top ten markets account for 66.7% of market share, and the tail beyond the top six alone has $32.4 billion. NVIDIA accounts for 3.5%. Apple, Tesla, Alphabet, and Microsoft combined account for 3.3%, only a quarter of SK Hynix. The mainstream narrative of tokenized US equities loves to talk about these American giants, but they are not the business here. Trade[XYZ] actually operates a 24/7 platform focused on storage and AI capex trading, plus crude oil, metals, and index products: Korean and Japanese semiconductors, a synthetic DRAM index, SpaceX, its own XYZ100 basket, and the licensed S&P 500. Its territory is assets that crypto-native traders cannot find elsewhere at 3 a.m. And this is exactly the territory Entropy chose to attack, with entry points at SanDisk and Nebius, not Apple. The most intuitive answer to why it does not list OpenAI—that it avoids private companies—is wrong. Pre-IPO markets are actually one of its better-performing businesses. SpaceX alone had $2.80 billion in volume over 30 days, accounting for 4.3% of the market and ranking ninth. It is followed by Unitree at $511 million, CXMT at $317 million, Zhipu at $156 million, MiniMax at $92 million, and SHEIN at $27 million, with YMTC registered and pending listing.
These names have one thing in common: they all have observable secondary market trading prices and known share counts. SpaceX conducts regular tender offers, providing clear per-share prices; these Chinese companies have active pre-IPO gray markets in mainland China, and share counts can be obtained from business registrations and financing rounds. Therefore, this platform can quote per share like any other asset.
OpenAI and Anthropic have neither. Their secondary market trades are wrapped in SPVs, trading claims on fund interests, and discussions revolve around overall negotiated valuations rather than specific per-share prices. Forcing a per-share quote is equivalent to creating a denominator out of thin air. The bottleneck is here; it is a matter of quoting convention, not willingness. Entropy's solution is not to quote per share, but to report the company itself directly: 1 contract = $1 billion market cap. At current mid prices, Anthropic is about $2.17 trillion and OpenAI about $1.53 trillion.
But this does not constitute a moat. The leader can add a market-cap-priced asset at any time for about $39,900. Moreover, its own roadmap points elsewhere: it has 16 registered but unused assets, including uranium, aluminum, the US Dollar Index, VIX, corn, wheat, TTF, Korean won, India Nifty, Brazil Ibovespa, Ibiden, and KSTR, plus YMTC and H100. This is macro and commodities, not cutting-edge AI labs.
One structural detail is worth noting. Trade[XYZ] has not set an oracleUpdater, meaning it does not use its deployment key to push mark prices; instead, both Entropy and Felix point to the same third-party updater 0x94757f8d…. Entropy has publicly stated that RedStone is the price data source for its Anthropic market, which explains why these two unrelated platforms share an update address, even though this address has no label on-chain. A self-built oracle is fine for assets with reference prices, but when the mark price must be "constructed," the nature changes, and constructing mark prices is exactly the business Entropy chose.
V. Direct Confrontation and the Week Entropy Led
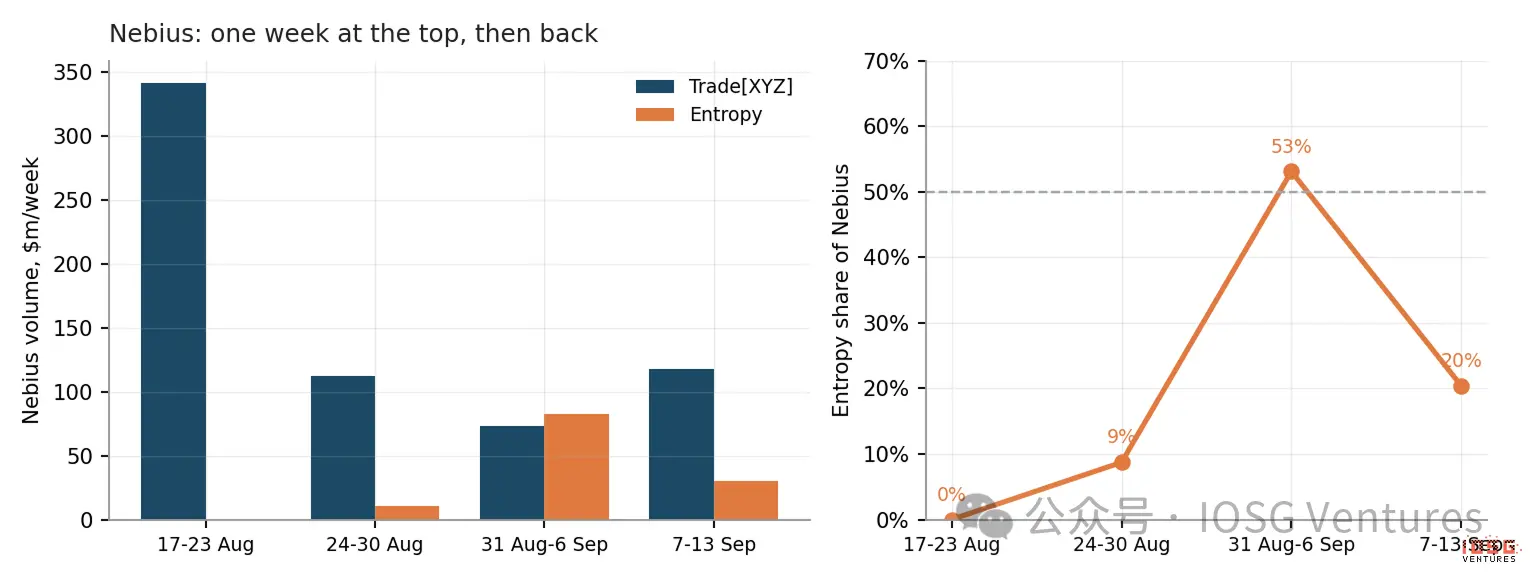 ▲ Weekly volume of Nebius and Entropy's share within it. Currently, nine assets are active on two HIP-3 platforms simultaneously. Platforms no longer occupy non-overlapping independent markets; any name worth listing twice has become the norm.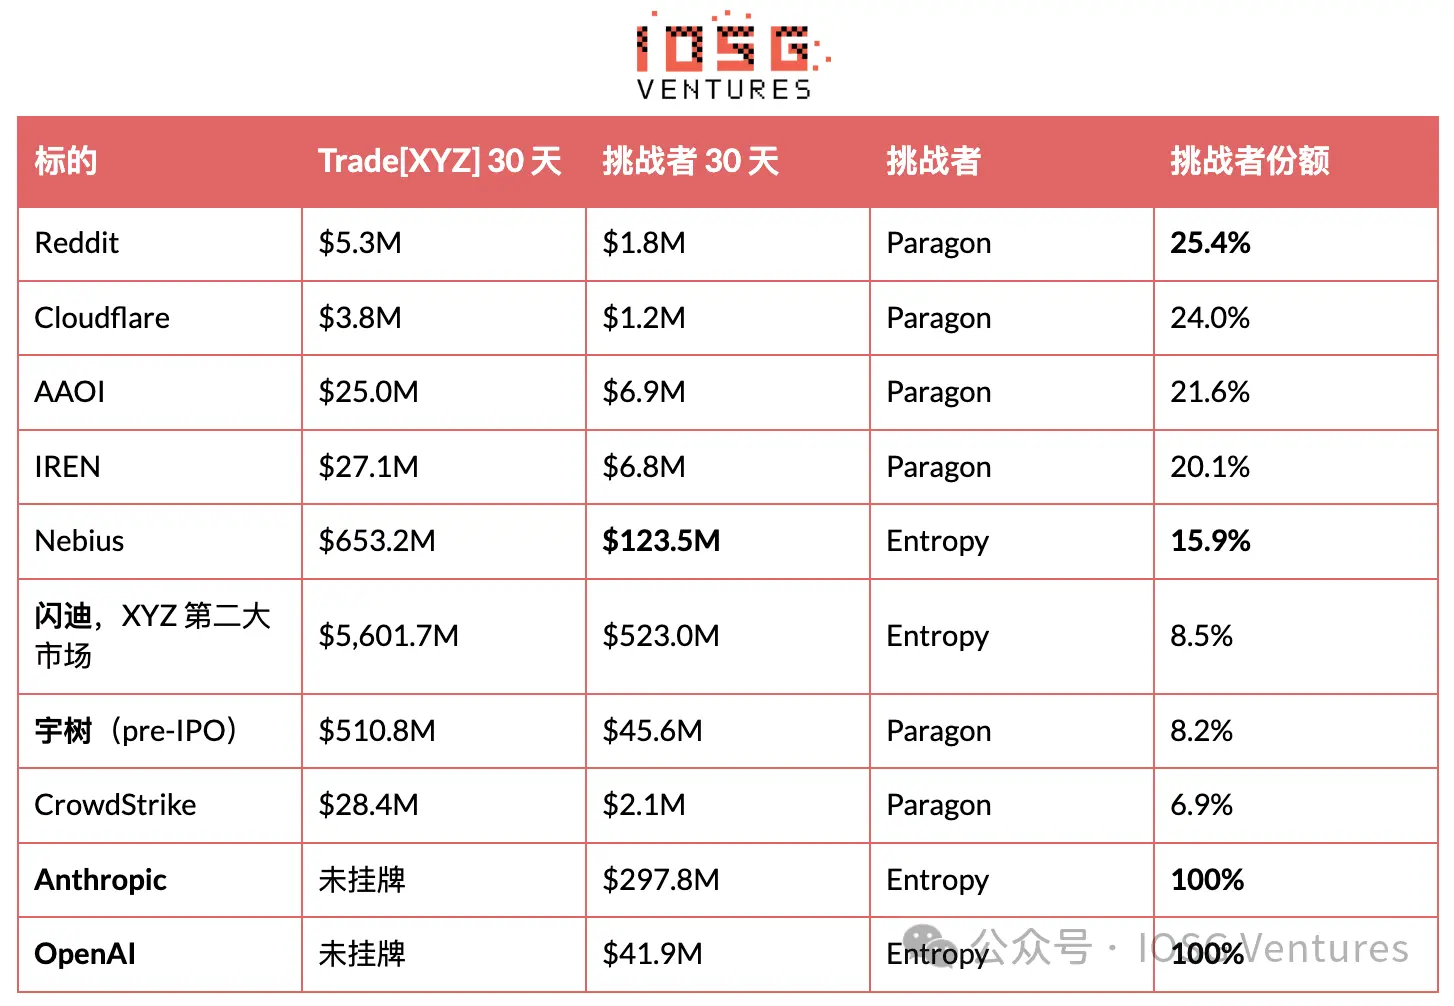
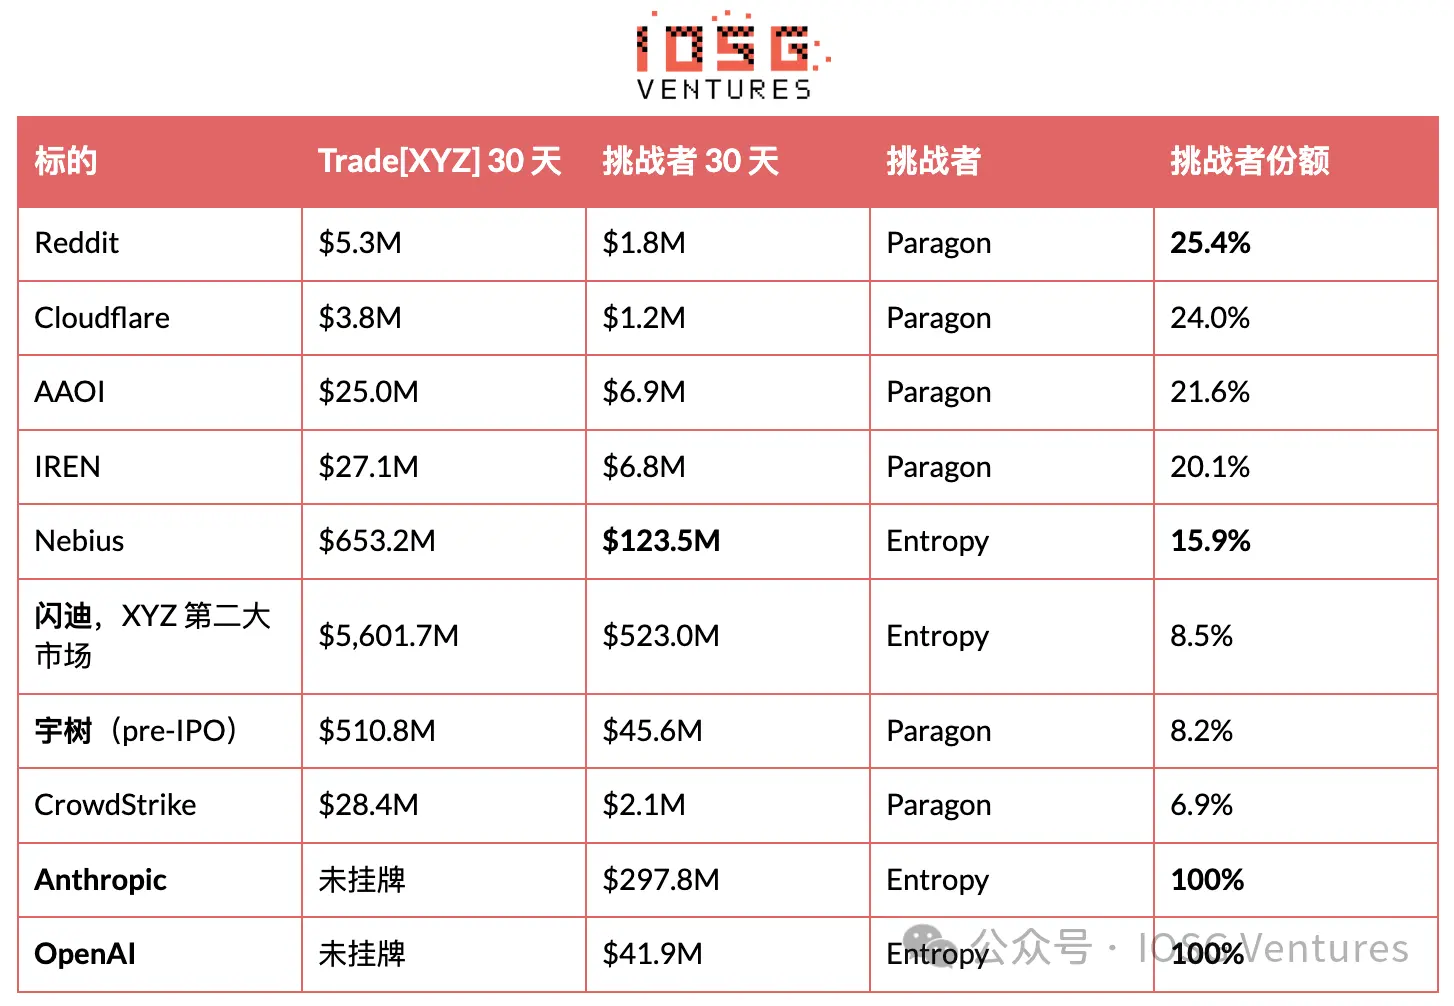 What was taken is positioning, not market depth. Trade[XYZ] had registered all five of Paragon's core targets but had not activated them. On Aug. 18, all targets were opened in a single day, and today it leads on all five. Filling this gap cost about three days of fee income, completed in one afternoon. Whether that batch of targets was deterrence or originally scheduled for launch cannot be determined from on-chain data.
What can be determined is the result. Four weeks later, Paragon still holds 20% to 25% share on four of the five, and overall monthly volume grew 49.9%. The mechanism is best illustrated by Unitree: Trade[XYZ]'s Unitree market depth is about 11 times that of Paragon, and the latter accounts for only 8.2% of this trading pair, but Paragon's own Unitree volume nearly doubled over the same period. The leader did not take volume away from the challenger; it expanded the market around the challenger. Entering a market and owning a market are two different things. Entropy led on Nebius for a week, then handed it back.
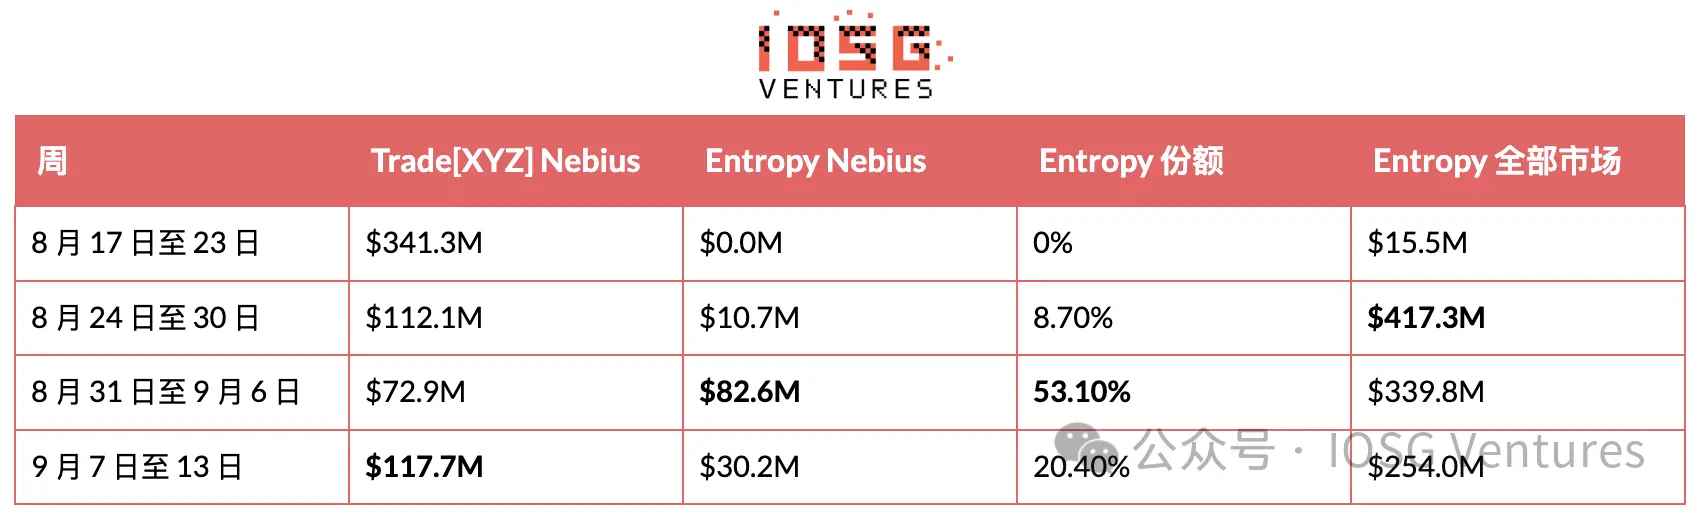
For one week, Entropy's Nebius volume did surpass Trade[XYZ], something no HIP-3 challenger had ever achieved. The following week, the leader's Nebius market depth increased by 61%, while Entropy's fell by 63%, and the challenger returned to one-fifth of this trading pair. SanDisk tells the same story, only more quietly: Entropy's market share has hovered around 13% in recent weeks, averaging 8.5% over the entire 30 days.
Therefore, this lead was real, but it lasted only one week. The honest interpretation is: Entropy proved it can penetrate a market where the leader actively quotes, but has not yet proven it can hold ground. Its total volume has declined for three consecutive weeks, from $417 million to $254 million.
The contrarian signal comes from inventory. While weekly volume fell 39% from its peak, Entropy's open interest actually increased 37% to $51.4 million, with the Anthropic target alone accounting for $29.9 million. Wash trading volume cancels out and leaves no inventory, so the continued accumulation of open interest while trading share declines indicates real positioning rather than fake volume. These two facts point in opposite directions; the real focus should be on this tension itself, not any single number.
The volume here needs to be discounted. Entropy has no token and has not confirmed any airdrop, but a pointsMultiplier parameter is already visible on the backend, and its leaderboard page shows "coming soon," so part of the traffic is driven by expectations rather than product usage, and the two cannot be distinguished externally. The scale also needs emphasis: Entropy's one-month volume is about $1 billion, while Trade[XYZ] is $64.6 billion, only 1.6% of the leader. It wins specific battles, not the category.
Its registered pending targets reveal the next step. Entropy holds EWY, SBE, TCNT, and a DRAM index. The DRAM index is Trade[XYZ]'s fourth-largest product, and EWY comes from Korea. The next confrontation seems aimed directly at the leader's core territory, rather than finding another uncontested pre-IPO name.
Two counting rules
Only count depth for listed markets. HIP-3 deployers often register targets long before launch; these targets return oracle markPx, but midPx is null, isDelisted is true, open interest is zero, and there is no candle history. Trade[XYZ] has 16, mkts has 19, Paragon has 9, and Entropy has 4. HyENA's 25 are a different matter, because they were launched and then closed.
Code strings do not equal targets. para:STX is Seagate, with a mid price of 799; STX in the core market is Stacks, with a mid price of 0.27. Relying on codes alone would create a tenth non-existent contested market out of thin air. Verify mid prices before pairing.
VI. The Economic Ledger: One Platform's Cost vs. the Entire Tier's Revenue
No one is competing on price, because fees have hit the floor. Everything depends on two parameters per asset, both public in metaAndAssetCtxs: growthMode and deployerFeeScale. The all-in fee is base × (1 + s), where base is the standard perpetual fee schedule and s is the deployer coefficient, which can be set from 0 to 3.00, capped at 1.00 in Growth Mode. The deployer takes s / (1 + s), so when s = 1.00, the two sides split evenly. Growth Mode then cuts the all-in figure by at least 90%, provided the market does not overlap with validator perpetual operations, which excludes crypto assets and crypto indices.
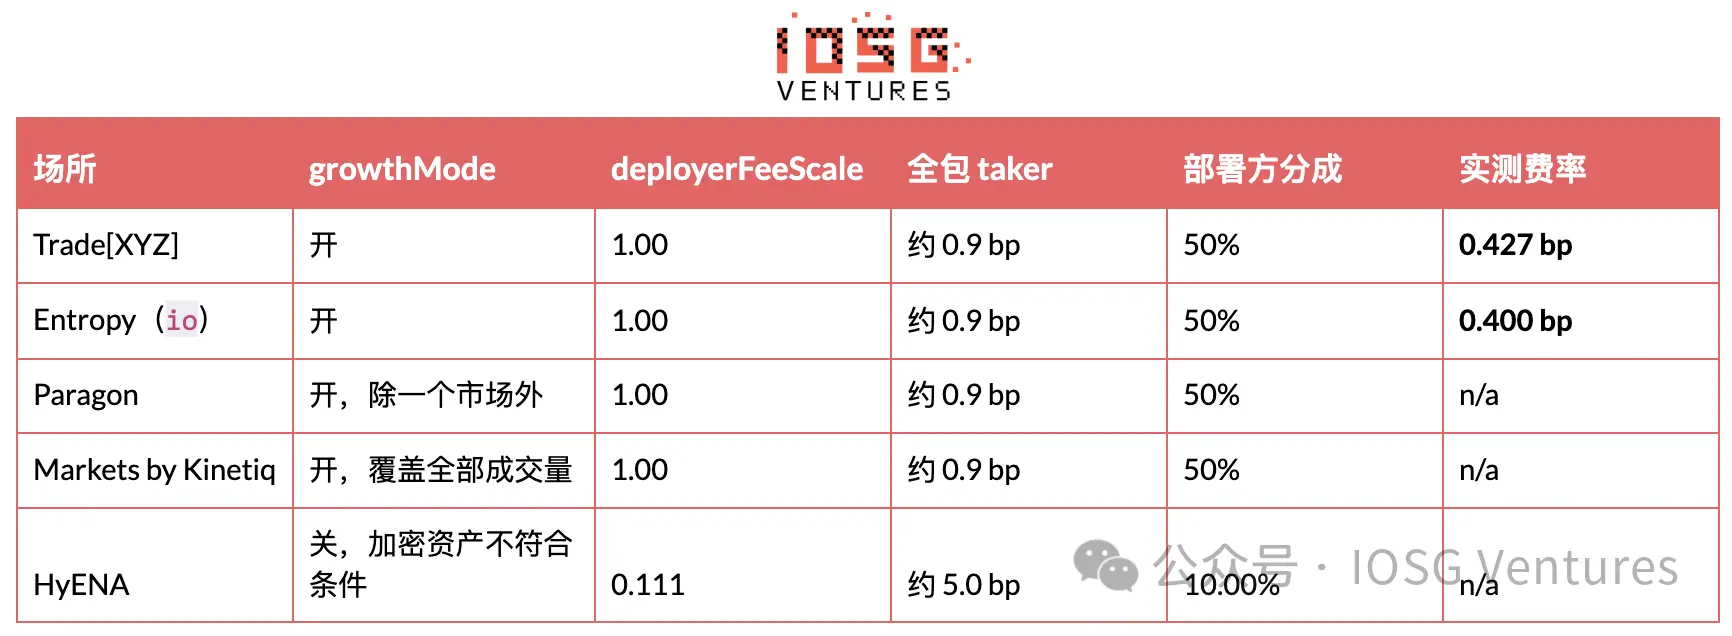
All equity platforms have independently converged to the same configuration: deployer fees maximized, Growth Mode activated. Entropy entered with differentiated products and venture capital and did not undercut prices. The only platform not in this configuration is the one that just stopped trading.
Without relying on any aggregator, deployer fees can still be calculated precisely. Fee income accumulates in sub-accounts of the fee address: the dex field of clearinghouseState can read the undistributed balance, and transfers appear in userNonFundingLedgerUpdates as sends with sourceDex equal to the platform name. Transfers are very irregular, so measurements must be taken between two transfers. Since the transfer on Aug. 27, Trade[XYZ] has accumulated $1,380,592, corresponding to $32.30 billion in volume, or 0.427 bp, about $79,000 per day. Entropy has never made a transfer, so its accumulated fees can be read directly: $1.036 billion in volume corresponds to $41,468, or 0.400 bp.
Two expenditures, fundamentally different in nature
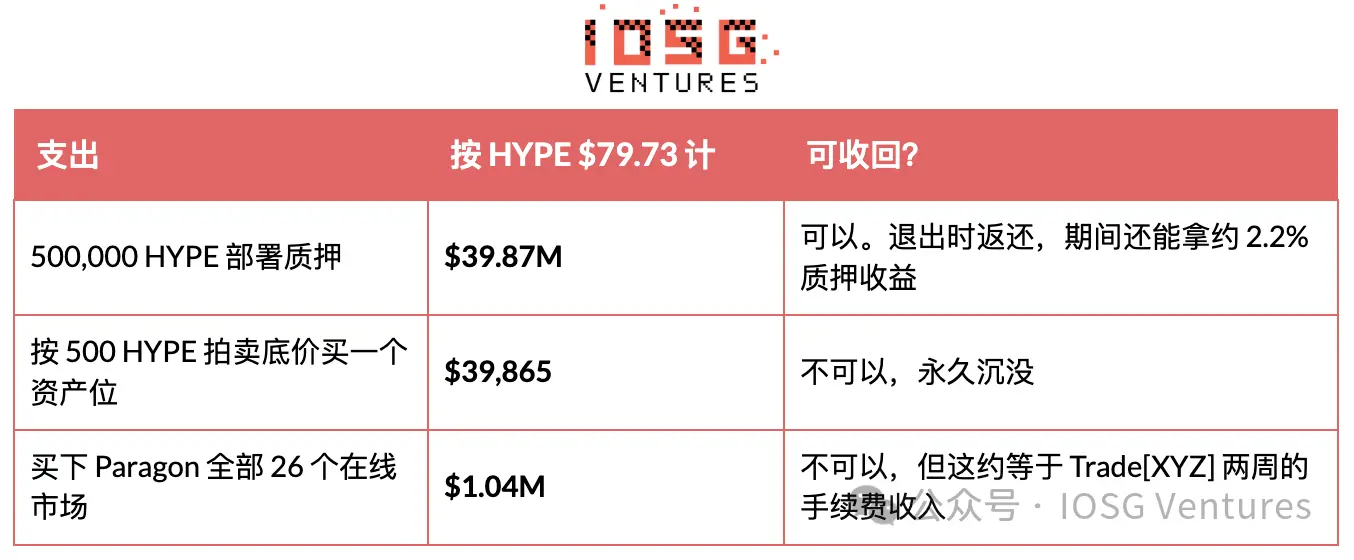
Staking is the most intimidating number, but it comes back. No one takes this money. It is delegated to validators, continuously generates staking rewards, and is returned in the same form upon exit. It is locked for at least 183 days from deployment and can be slashed by weighted validators for malicious market manipulation (such as pushing bad oracle prices), and can still be slashed during the 7-day unstaking queue, so a clean exit takes at least about 190 days. Felix and dreamcash have both fully withdrawn, with current readings at zero.
Current staked amounts: Entropy 500,973, Paragon 500,712, HyENA 508,915 (stopped trading but not unstaked), Kinetiq 588,489 (one stake covers both km and mkts), Trade[XYZ] 500,488 plus 500,269 at another address. ABCDEx has only 1,004 HYPE and never staked.
The money for asset slots is the part no one mentions and that truly cannot be returned. The first three assets of any perpetual DEX are free; thereafter, each new market must be purchased with HYPE in a Dutch auction lasting 31 hours, opening at twice the last transaction price and linearly decreasing to a floor of 500 HYPE. The auction entered on Sep. 14 started at the floor of 500 and ended at 500, so one asset slot costs about $39,900, and demand for asset slots has declined from a week ago when the transaction price was 582 HYPE.
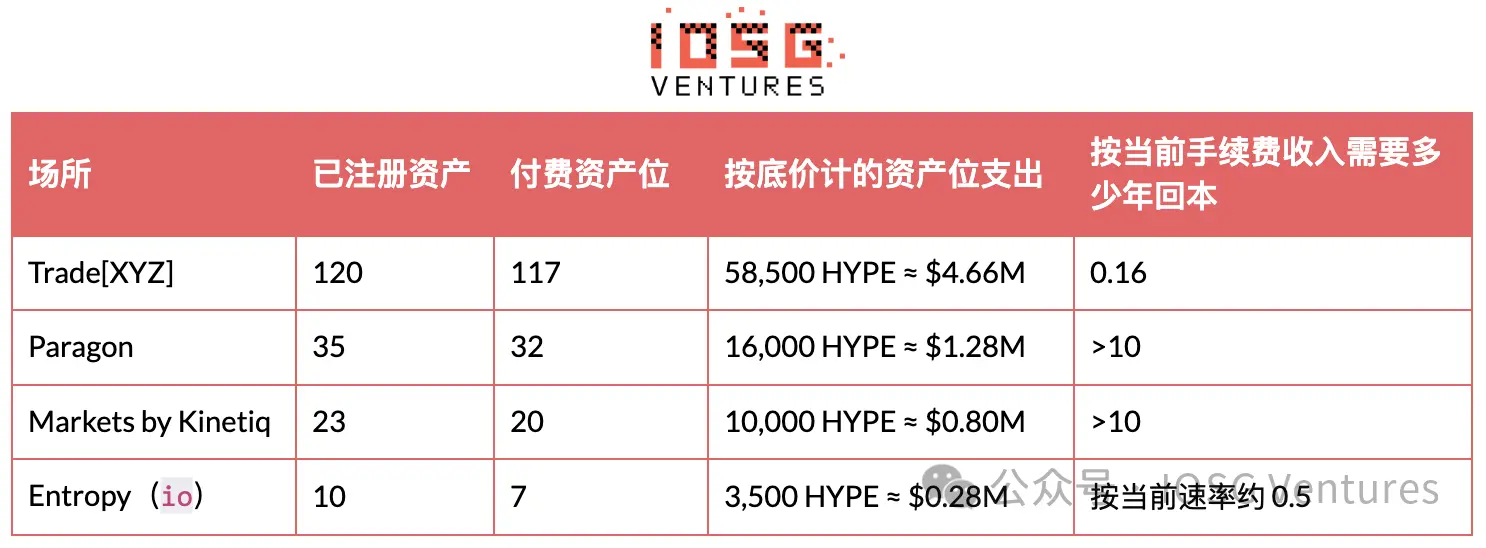 The last column is key. Trade[XYZ]'s fees for about eight weeks can pay all target bills. Except for Entropy, every challenger needs more time than HIP-3 has existed; Entropy passes only because it bought seven asset slots, not thirty.
Time will continue to amplify this asymmetry. Pausing markets is free and reversible; paid asset slots can be shelved and reopened, and those "pending targets" come from this. Reserve slots accumulate based on historical deployment count, with the formula 7 + 0.2 × past auction deployments, so Trade[XYZ] has about 30 available immediately, while a new entrant has only 7. A platform opening today and planning to create 20 markets can list 10 at once, and the rest must queue in auctions, at the fastest one every 31 hours. Entropy's answer is not to follow this rhythm: it listed only five markets and made each one work. The staking yield trap. Except for Entropy, every challenger that earns money from the passive staking ticket earns more than from operating an exchange. Paragon's lifetime deployer fees are $64,281, while its $39.87 million stake at about 2.2% generates about $877,000 per year, a ratio of about 14 times.
This is not consolation. That yield is newly minted HYPE from the protocol's future issuance reserve, essentially inflation rather than revenue, a dilutive return on an involuntarily held position, valued in an asset the operator is already passively long. A 30% drop in HYPE would cause a $12 million loss on this stake, exceeding ten years of yield. Over the past eight days, HYPE fell from $88.37 to $79.73, reducing each stake by $4.3 million. How big a business can this fee pool support? Growth Mode pins the effective rate at about 0.4 bp, with the deployer taking half. Trade[XYZ] holds 97.8% market share, with annualized volume of about $786 billion and annual deployer fees of about $29 million. Rather than saying this is the leader's ceiling, it is essentially the total prize for the entire platform tier under current volume and current fee floors.
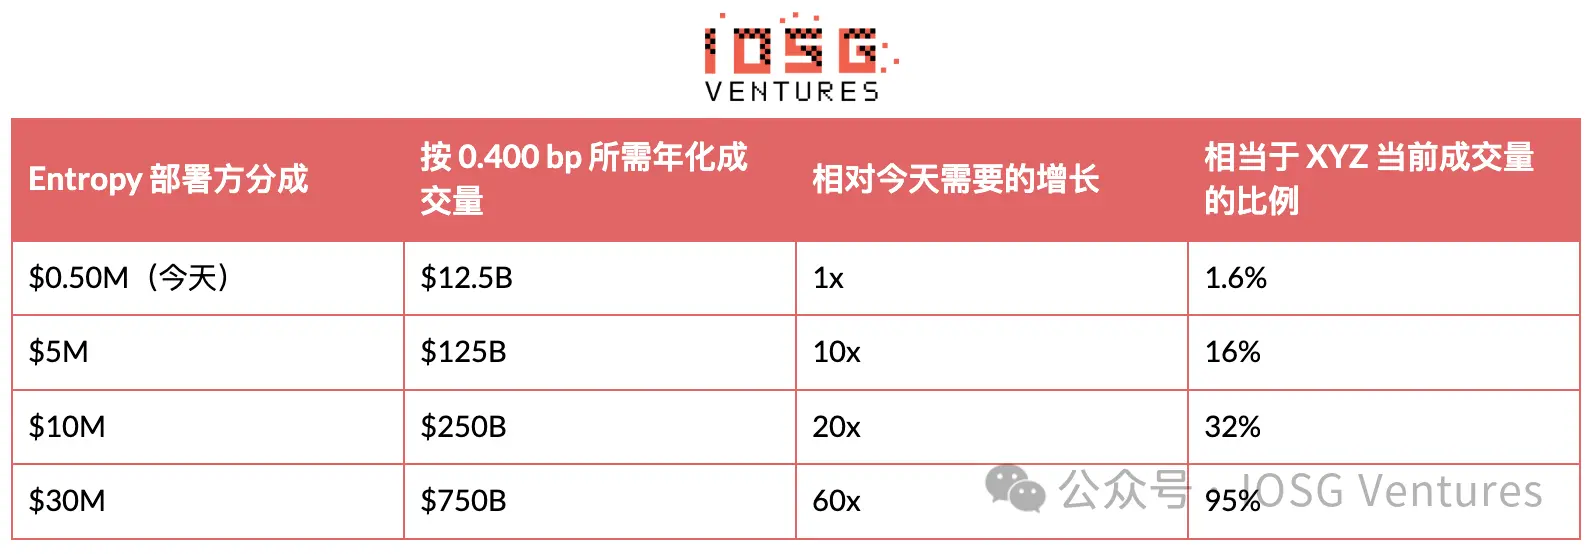
Outside the leading platform, about $167 million in HYPE is currently staked, and these platforms, regardless of their fate, have collectively earned only $747,000 in deployer fees over their lifetimes. Compared with a $14 million seed round, this arithmetic shows that under current volume and fee floors, HIP-3 operators cannot rely on trading fees for valuation. The challenger's value must come from elsewhere: tokens, frontends, customer relationships, or some product the protocol has not yet priced.
VII. What Can Truly Be Held
HIP-3 deliberately commoditizes most of what a platform could originally hold. Staking can be bought, underlyings can be bought, fee floors are shared, and even distribution is shared, because every HIP-3 market is accessible from the same frontend.
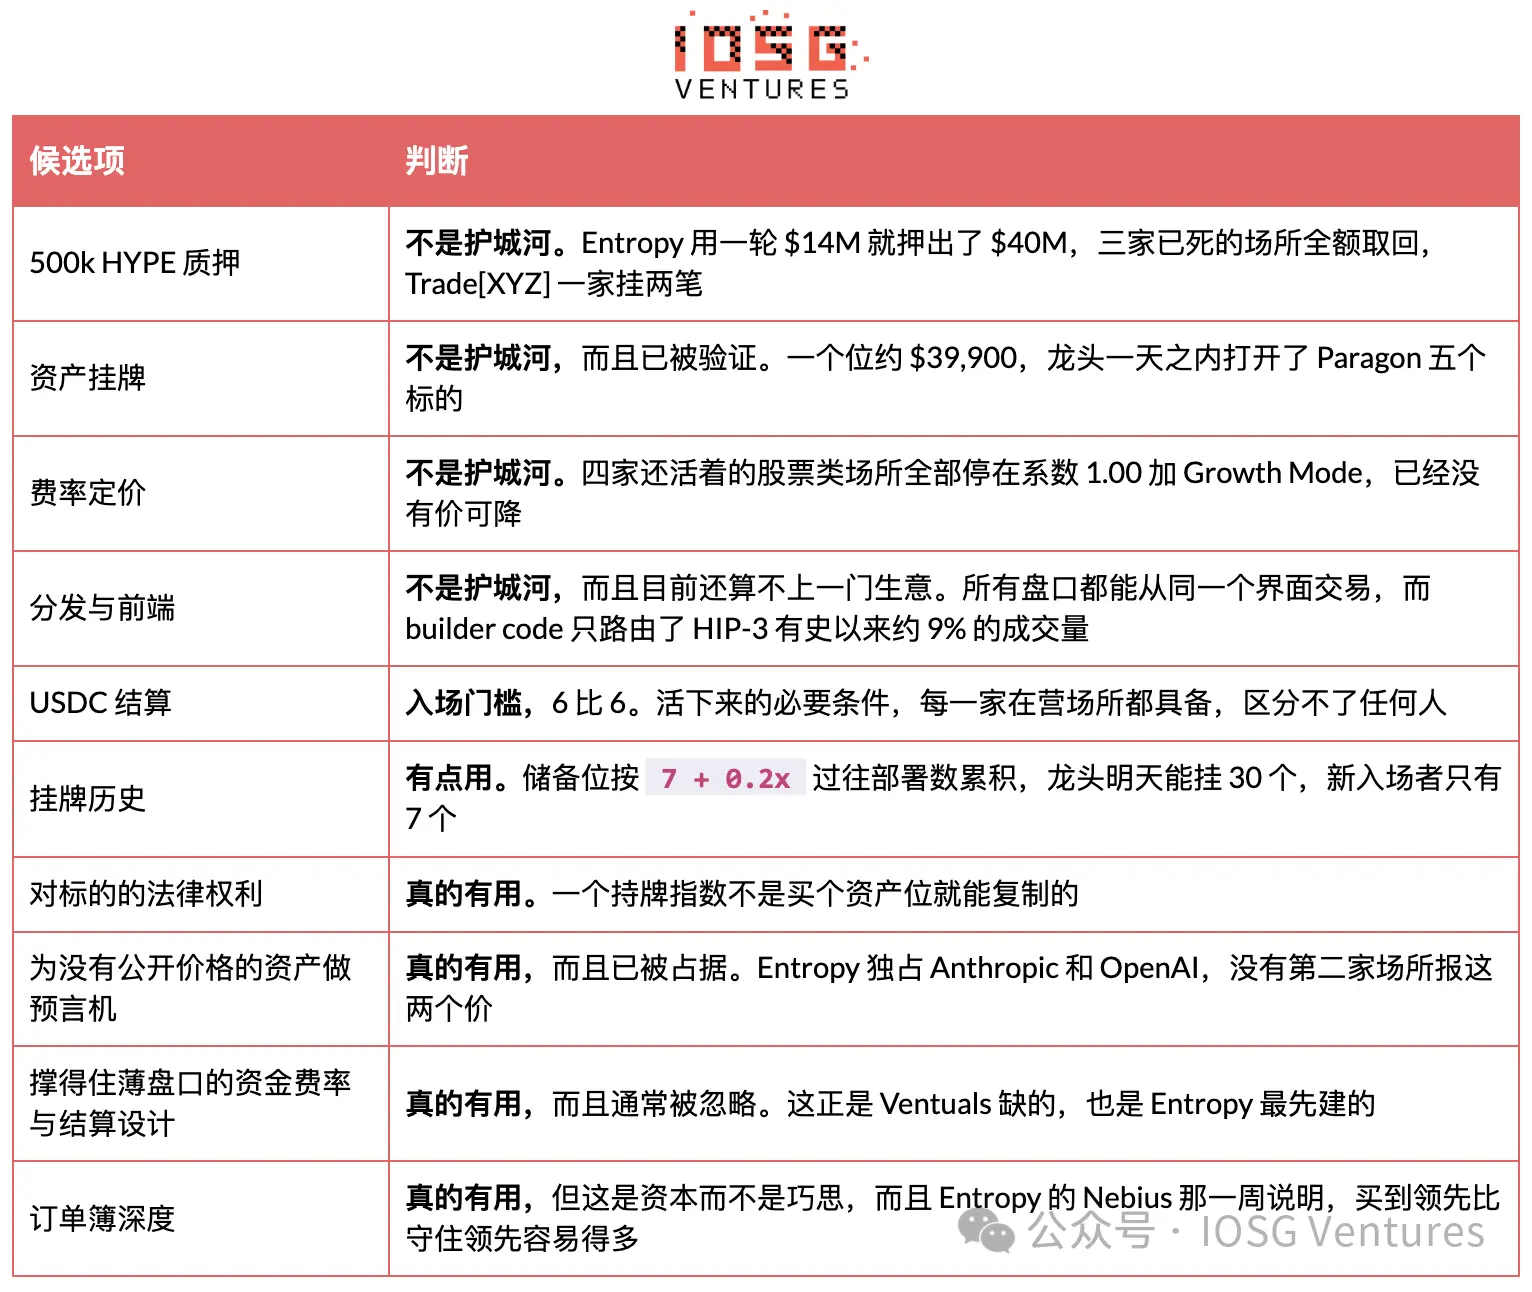 The useful screening question is not "which assets do you want to list," because assets can be bought. It is "what do you have that the leader cannot buy with one asset slot." Among all platforms that have ever operated on HIP-3, only one has a clear answer to this question, and its answer is a set of oracles plus settlement design, not an asset list.
Entropy is the exception worth mentioning precisely, because the answer is not in the underlyings. It was founded by researchers and traders from Citadel Securities, Optiver, Millennium, and Polymarket, and this foundation shows in two ways. One is order depth from day one, which did impress on Nebius. The other is funding rate and settlement design, which reads like a direct response to Ventuals' death. Its $14 million seed round was led by Ribbit Capital, which focuses mainly on retail brokerage and fintech distribution rather than DeFi, indicating its ambition is to retain customers, not just leverage a protocol. It must be noted that Entropy Advisors, which has deep ties to Arbitrum DAO, and Entropy, an a16z-backed custody startup, are completely different companies, and no relationship with Hyper Foundation should be inferred from the name.
Putting all this together, this sector still looks thin. One shrinking company accounts for 97.8% of volume. A circle of challengers holds $167 million in HYPE, with historical fees among themselves totaling $747,000 in returns. The only team that can truly quote just proved it can take a market for a week but cannot hold it.
A more direct alternative is to take the protocol's half of trading fees, rather than the operator's half; it has no lockup, no confiscation risk, and no operational burden. However, it is also not the mainstay of Hyperliquid's perpetual fee base, and it has been proven that HIP-3 market share above 50% is an illusion of low crypto activity, not a trend. The routing layer and its actual traffic impact. Builder codes are the closest thing to "shared business" on HIP-3. Orders sent from frontends are tagged and earn builder fees without posting collateral. Flowscan counts 819 such tags.
They indeed encounter little traffic. Routed volume is about $52.6 billion, roughly 9% of HIP-3's historical total of $587 billion; over the past 30 days it is about $5.3 billion, corresponding to $66.09 billion, about 8%. More than 90% of traffic has no frontend tag, which is exactly what a market dominated by market makers and API traders should look like.
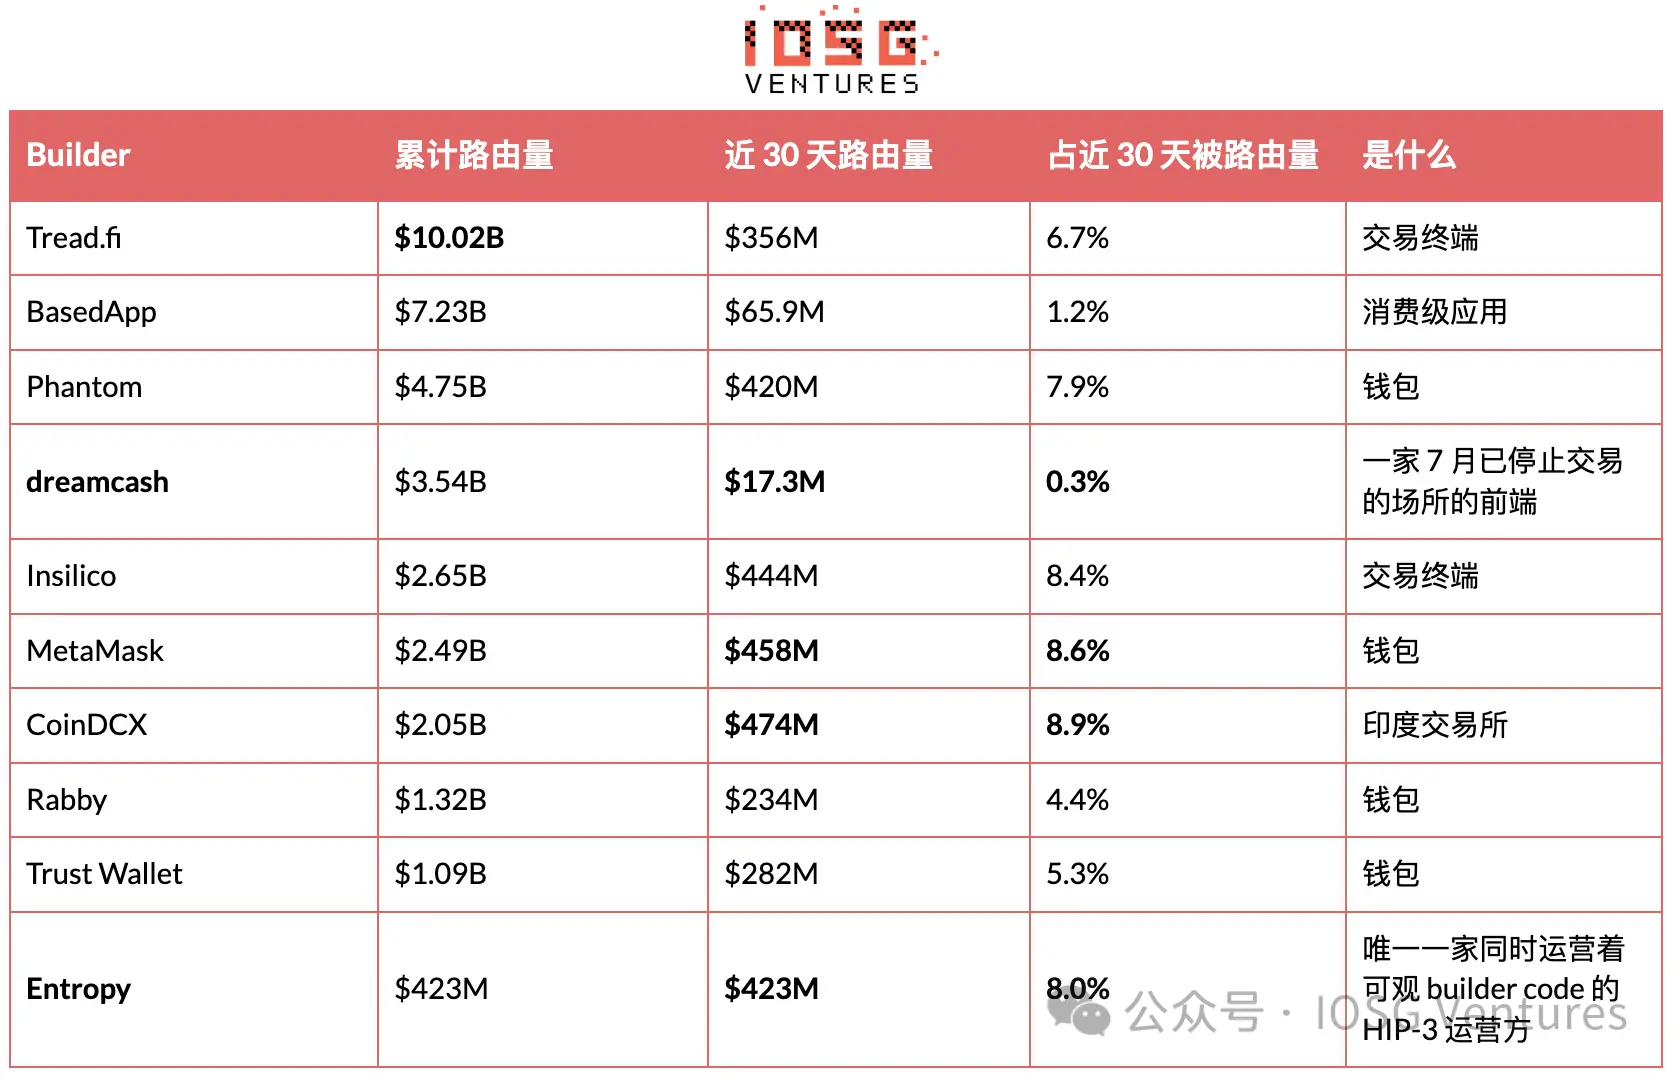 The denominator in the fourth column is the total routed by builder codes over the past 30 days, $5.30 billion, not HIP-3's $66.09 billion volume. If it were the latter, the largest, CoinDCX, would account for only 0.7%. The ten companies in the table together account for 59.7% of routed volume, while Flowscan counts 819 builder codes in total, meaning the remaining 809 share the other 40%.
Two things in this table are worth noting. Entropy's $423 million in routed volume all occurred in the past 30 days, while its own platform traded $1.03 billion over the same period, meaning about 40% of the market comes from its own controlled frontend. The ambition behind Ribbit in that funding round is reflected in the data, not just in press releases, and this is a business distinct from "being a deployer."
The other point is dreamcash, which offers a cleaner lesson. Its platform has been dead since July 2, with its own market readings at zero, but its builder code still routed $17.3 million over the past 30 days, totaling $3.54 billion. The deployment business and the frontend business can be cleanly separated, and only one of them requires $40 million to enter.
There is an easily overlooked counting trap on third-party dashboards. Platform rankings usually default to cumulative volume, so a platform that stopped operating months ago may still show a considerable share. Dreamcash shows 3.3% of HIP-3 volume in the all-history view, but in any recent window, it is $0. Before citing any share, confirm its calculation window. Therefore, the frontends worth monitoring are mostly not deployers. Coinbase announced on Sep. 12 the launch of a simplified perpetual interface within its wallet, powered by Hyperliquid, covering crypto, tokenized equities, and prediction markets, for markets outside the US. Kraken's parent company is also discussing integrating Hyperliquid-related perpetuals into a regulated US platform. Neither will stake that 500,000 HYPE. Conclusion: it is hard to be optimistic about another HIP-3 deployer. Putting all the above information together, a new HIP-3 platform faces the following set of numbers.
All HIP-3 volume outside the leader totals $1.49 billion over 30 days, annualized to about $18.1 billion. At the measured 0.400 bp, annual deployer fees are $725,000, shared by four platforms. These four platforms currently hold about $167 million in HYPE. The same amount passively staked at 2.2% yields $3.67 million per year.
In other words, the money earned from operating these exchanges is about one-fifth of the yield from staking the same capital in place.
This is not an untapped market, but a market priced to near zero, for reasons measurable as described in previous sections. Asset slots cost $39,900 and cannot hold anything; fee floors are shared, with no price to cut; distribution is also shared, with builder codes encountering only 9% of traffic; settlement assets have converged to 6:6 USDC, and AQAv2 explicitly provides no fee favoritism to HIP-3, so the protocol does not intend to subsidize this tier.
More challenging is the ceiling. XYZ has 97.8% market share and all structural advantages, yet achieves only 1.2% of real trading on the nine stocks it quotes, and its relative share on core storage assets is still declining. New entrants face not "the leader is too big," but "the leader is already small and getting smaller."
There remains only one exception, as clearly stated earlier: a right others cannot buy, an oracle others cannot produce, or a funding rate and settlement design that can survive in thin markets. Entropy is the only one that qualifies, and it was pushed back after leading for a week. Asset lists are not the answer, and this view is now supported by two independent sets of data that agree. What could change this judgment
Entropy can hold a contested market for a month rather than a week, and maintain its share against Shandi instead of drifting around 13%. Accumulating open interest while volume declines is the most noteworthy signal, because it is more reliable than volume.
Entropy's DRAM index and Korean assets go live. These two point directly at the leader's core territory, rather than another uncontested pre-IPO name, and the result will be a much cleaner test than Nebius.
Token terms could make the equity math work. The fee math does not work, and the token does not exist today.
The pre-IPO sector can persist. Anthropic's market declined after the first week, and OpenAI opened at $5.3 million per day and is now about $4 million. As long as one stabilizes, this becomes a category rather than a one-time listing trend.
AQAv2's first payment arrives in early October. That will be the first opportunity to observe the true scale of the protocol's USDC yield line, to compare with current third-party estimates of $135 million to $200 million.
Fee floors loosen. Hyperliquid hinted in early August that subsequent upgrades will allow HIP-3 deployers to raise fees on individual assets by up to 3 times, essentially reversing the Growth Mode discount. No timeline was given, and every number in Section 6 is built on the current floor.
Implementation of permissioned markets. HIP-3* was announced on Sep. 3, an optional on-chain whitelist that allows deployers to restrict which wallets can trade a market, aimed at compliance and institutional access, currently only on testnet. This is the first mechanism that could make "access rights" rather than "assets" a scarce commodity.
A team emerges holding exclusive data or index licenses, with assets that truly have 24/7 crypto-native demand. This remains the only configuration that completely invalidates the slot-grabbing logic.
Evidence shows the leader's volume cannot be sustained after Growth Mode ends. Its measured 0.427 bp is only about one-tenth of what the same market would earn under standard fees; if this exemption constitutes a burden, the leader's stability is not as solid as its share suggests.
HyENA unstakes its 508,915 HYPE, confirming the platform is finished rather than dormant.
Some limitations
The slot-grabbing argument is based on measured share, but motivation is inference. Five assets going live on the same day could also be interpreted as a release pipeline that happened to complete that day.
The judgment on Entropy is based on only 26 days of data. The Nebius lead and subsequent reversal are readings from a single week and a single mid-cap asset, neither of which should be treated as a settled conclusion.
Team backgrounds and funding rounds come from company announcements and media reports, not verifiable on-chain information.
The volatility conclusion in Section 2 is based on correlation over a 45-weekday sample, not causal decomposition. Volume and actual volatility could also be driven by the same factor, with the most direct candidate being the overall cooling of AI capex trading.
Trade count does not equal trader count; the public API cannot produce independent traders.
Capital return figures are calculated at HYPE $79.73 and a 2.2% annualized staking rate, the latter being a protocol parameter rather than a contractual commitment, and will decline as total network staking increases.
This content is for informational and educational purposes only and does not constitute investment advice related to BTCC. BTCC makes every effort but cannot guarantee the truthfulness, accuracy, or originality of the content above.