VTI ETF Market Pulse: Key Movements & Analysis for November 10, 2025

Wall Street's favorite broad-market ETF shows its teeth as volatility returns.
Where's the smart money flowing? VTI's volume spike suggests institutional players are repositioning—just don't ask your financial advisor why they're still charging 1% for this.
Technical breakdown: The 200-day MA held... barely. Traders eyeing the $250 level like crypto degens watching Bitcoin's support zones.
Macro whispers: Fed pivot rumors giving ETFs a sugar rush—enjoy it while it lasts before the next CPI gut punch.
Remember kids: 'Diversification' is what finance bros call losing money in multiple asset classes simultaneously.
Meet Your ETF AI Analyst
- Discover how TipRanks' ETF AI Analyst can help you make smarter investment decisions
- Explore ETFs TipRanks' users love and see what insights the ETF AI Analyst reveals about the ones you follow.
VTI ETF’s Latest Performance
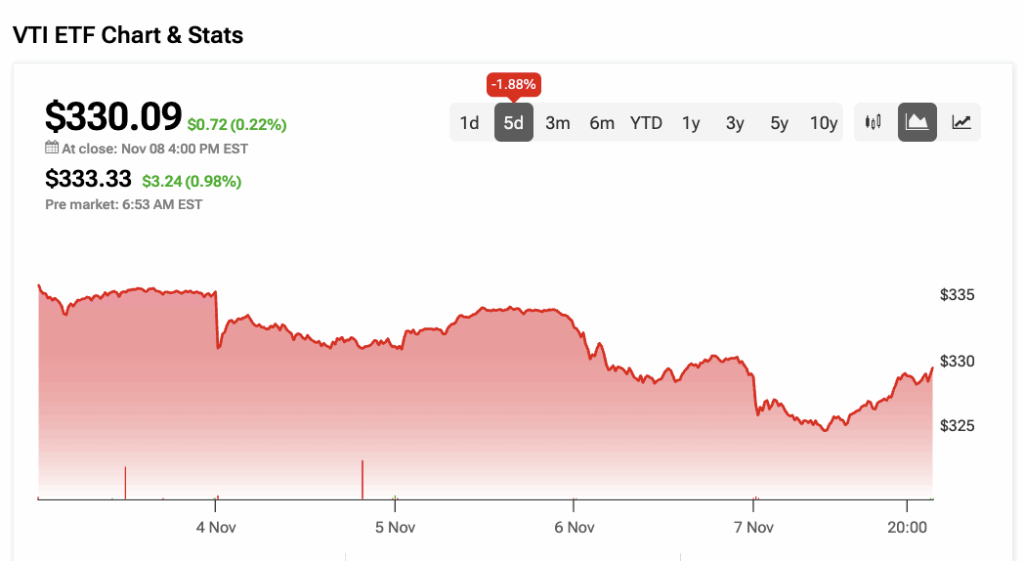
The VTI ETF gained 0.22% on Friday. In contrast, the Nasdaq Composite declined by 0.21%, while the S&P 500 was up by 0.13%. Investors continue to watch market volatility closely, as growing fears of an AI bubble keep weighing on overall sentiment.
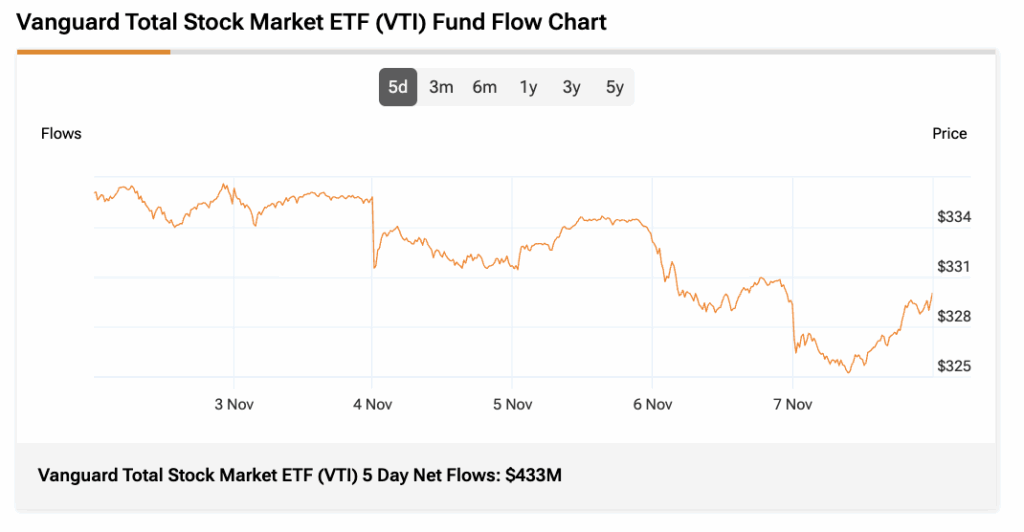
VTI’s three-month average trading volume is 4.04 million shares. Meanwhile, its 5-day net flows totaled $433 million, showing that investors added capital to VTI over the past five trading days.
Technical Snapshot
From a technical standpoint, VTI remains above its 50-day moving average. Notably, VTI is trading at $330.09, compared to its 50-day exponential moving average of $326.93, indicating a bullish trend and a potential Buy signal.
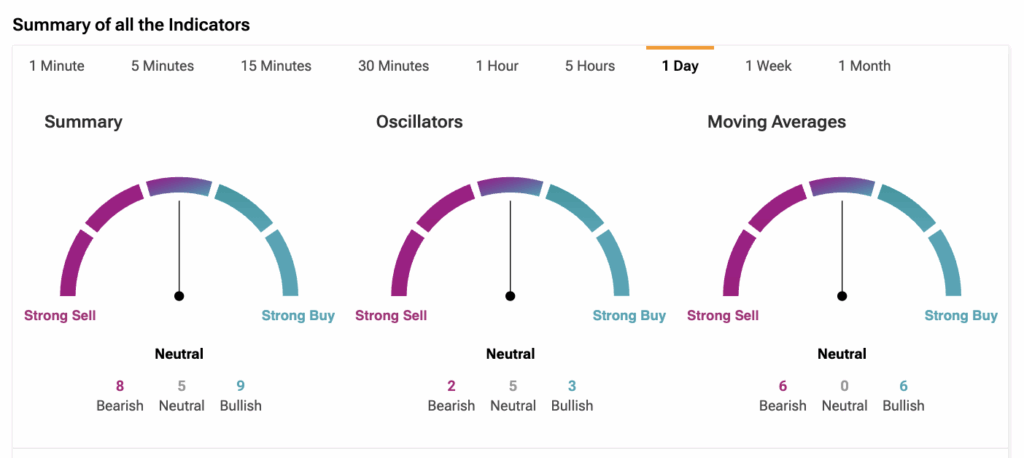
According to TipRanks Technical Analysis, VTI has a Neutral rating based on the overall summary and the moving average consensus.
VTI’s Price Forecasts and Holdings
According to TipRanks’ unique ETF analyst consensus, determined based on a weighted average of analyst ratings on its holdings, VTI is a Moderate Buy. The Street’s average price target of $387.53 implies an upside of 17.40%.
VTI’s top three holdings are chipmaker Nvidia (NVDA) at 6.69%, followed by tech giants Microsoft (MSFT) at 5.98% and Apple (AAPL) at 5.87% of the fund’s total weight.
Currently, VTI’s five holdings with the highest upside potential are Cibus (CBUS), BioAtla (BCAB), NRX Pharmaceuticals (NRXP), FibroBiologics (FBLG), and Clearside Biomedical (CLSD).
Meanwhile, its holdings with the greatest downside potential are LiveOne (LVO), Opendoor Technologies (OPEN), iHeartMedia (IHRT), and Fluence Energy (FLNC).
Notably, VTI ETF’s Smart Score is seven, implying that this ETF is likely to perform in line with the broader market.
