S&P 500 Set for Historic 100-Year Pattern - Only 11 Previous Occurrences Signal Major 2026 Market Move

The S&P 500 is lining up for a statistical anomaly that's occurred just 11 times over the past century - and historical data suggests this rare setup could trigger significant market movements in 2026.
Century-Long Pattern Emerges
Market analysts are tracking a convergence of technical indicators that previously preceded major market shifts. The current alignment mirrors patterns seen only 11 times since 1925, each followed by substantial price movements within 12-18 months.
Historical Precedents Don't Lie
Previous occurrences of this configuration led to average market moves of 18-24% in either direction. The pattern's rarity makes it particularly noteworthy for institutional investors positioning for 2026 volatility.
Timing the 2026 Catalyst
While past performance never guarantees future results - something Wall Street conveniently forgets between bonus seasons - the statistical significance demands attention. Market makers are already building positions for what could be the most talked-about move of mid-decade.

Image source: Getty Images.
The third time's the charm
The S&P 500 soared 26% in 2023. It followed with a 25% gain in 2024. As of the market close on Oct. 10, 2025, the S&P is up a little over 11%. As things stand right now, it's on course to finish the year with a double-digit percentage gain for the third consecutive year.
Such an achievement is rarer than you might think. Over the last 100 years, the S&P 500 has delivered double-digit returns for three consecutive years only 11 times. Technically, the index has only existed in its current form, including 500 companies, for 68 years. However, the S&P 500's predecessor -- the S&P 90 -- dates back to 1926.
Granted, the stock market could end 2025 on a negative note. President Trump's latest threat of additional 100% tariffs on all Chinese imports, on top of 30% tariffs already in place, is causing significant angst among investors.
It doesn't help matters that the S&P 500 has been trading at record highs. The Buffett indicator, a ratio of total U.S. stock market capitalization to GDP, is well above a level that its namesake, legendary investor Warren Buffett, has said was "playing with fire."
However, even if the S&P 500 falls over the next few weeks, a rebound to get the index back into double-digit gain territory would still be quite possible. Stocks often enjoy momentum at the end of a year thanks to a phenomenon known as the Santa Claus rally.
A history of big moves following three double-digit years
What could a third consecutive year of double-digit gains for the S&P 500 potentially mean for stocks in 2026? History shows that big moves often follow.
In three of the 11 cases over the last 100 years where the S&P jumped by double digits for three years in a row, the trend soon came to an abrupt end. For example, the S&P 500's predecessor began with a bang in 1926, racking up three back-to-back double-digit returns. However, any student of history knows what happened in 1929: The stock market crash in October of that year brought a screeching halt to the previous momentum. The S&P finished the year down 8% and continued to decline for the next three years.
More recently, the index generated strong double-digit returns in 2019, 2020, and 2021. But the S&P 500 plunged 18% in 2022 as the Federal Reserve cranked up interest rates.
In four of the 11 cases, though, the strong momentum extended into a fourth year. The first occurrence came during World War II. The S&P soared 20% in 1942, followed by a gain of nearly 26% in 1943 and a 36% jump in 1944. The best was yet to come, with the index skyrocketing 36% in 1945 as the war ended.
Another great example of a three-year streak continuing into a fourth year was during the heady dot-com boom of the 1990s. The S&P 500 delivered returns of 22% or more in 1995, 1996, and 1997. It slowed only slightly in 1998, with a nice gain of 21%.
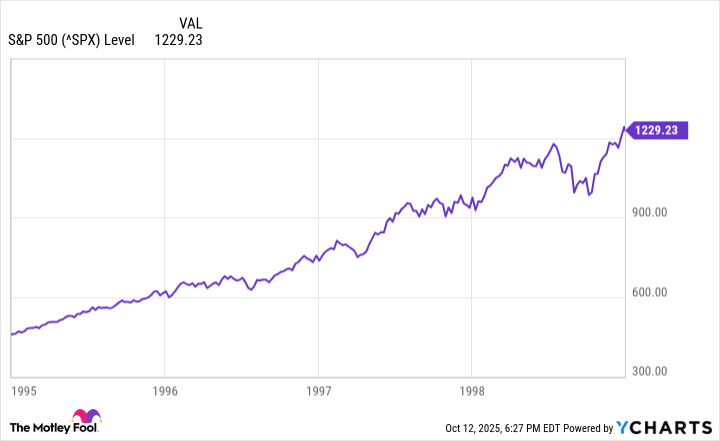
^SPX data by YCharts
How will the S&P 500 perform in 2026?
History shows that big moves are common after three consecutive years of double-digit gains by the S&P 500. Unfortunately, stocks tumble nearly as often as they jump in the following year. How will the S&P 500 perform in 2026? It's impossible to know for sure.
What is possible to know, though, is that the S&P 500 has always risen over the long term in the past. The Rolling Stones weren't talking about the stock market when they sang "Time Is on My Side," but their premise definitely applies to investing. Regardless of what the S&P 500 does next year, investors who maintain a long-term perspective are likely to make money.
