Ethereum’s Ascent Continues: Bullish Markets Signal Higher Peaks Ahead
Ethereum isn't just climbing—it's rewriting the crypto playbook while traditional finance scrambles to keep up.
The Momentum Engine
Market sentiment fuels Ethereum's relentless push upward. Traders pile in, institutions allocate, and the network just keeps swallowing demand whole—no apologies, no looking back.
Beyond the Hype
This isn't mere speculation. Real utility—decentralized applications, smart contracts, an entire ecosystem—drives value where traditional assets often just… sit there. Banking executives, meanwhile, still debate whether crypto is 'a phase.'
Where It’s Headed
Higher. Always higher. Until the next resistance level shatters, the next all-time high prints, and the next wave of skeptics finally buys in—probably at the top.
Ethereum (ETH) price: Where does it go next?
Overall, crypto markets today are bouncing after a turbulent weekend. A single Bitcoin whale unloaded $2.7 billion worth of BTC on Sunday, setting off cascading liquidations as long positions were forcibly closed and the price of BTC plunged.
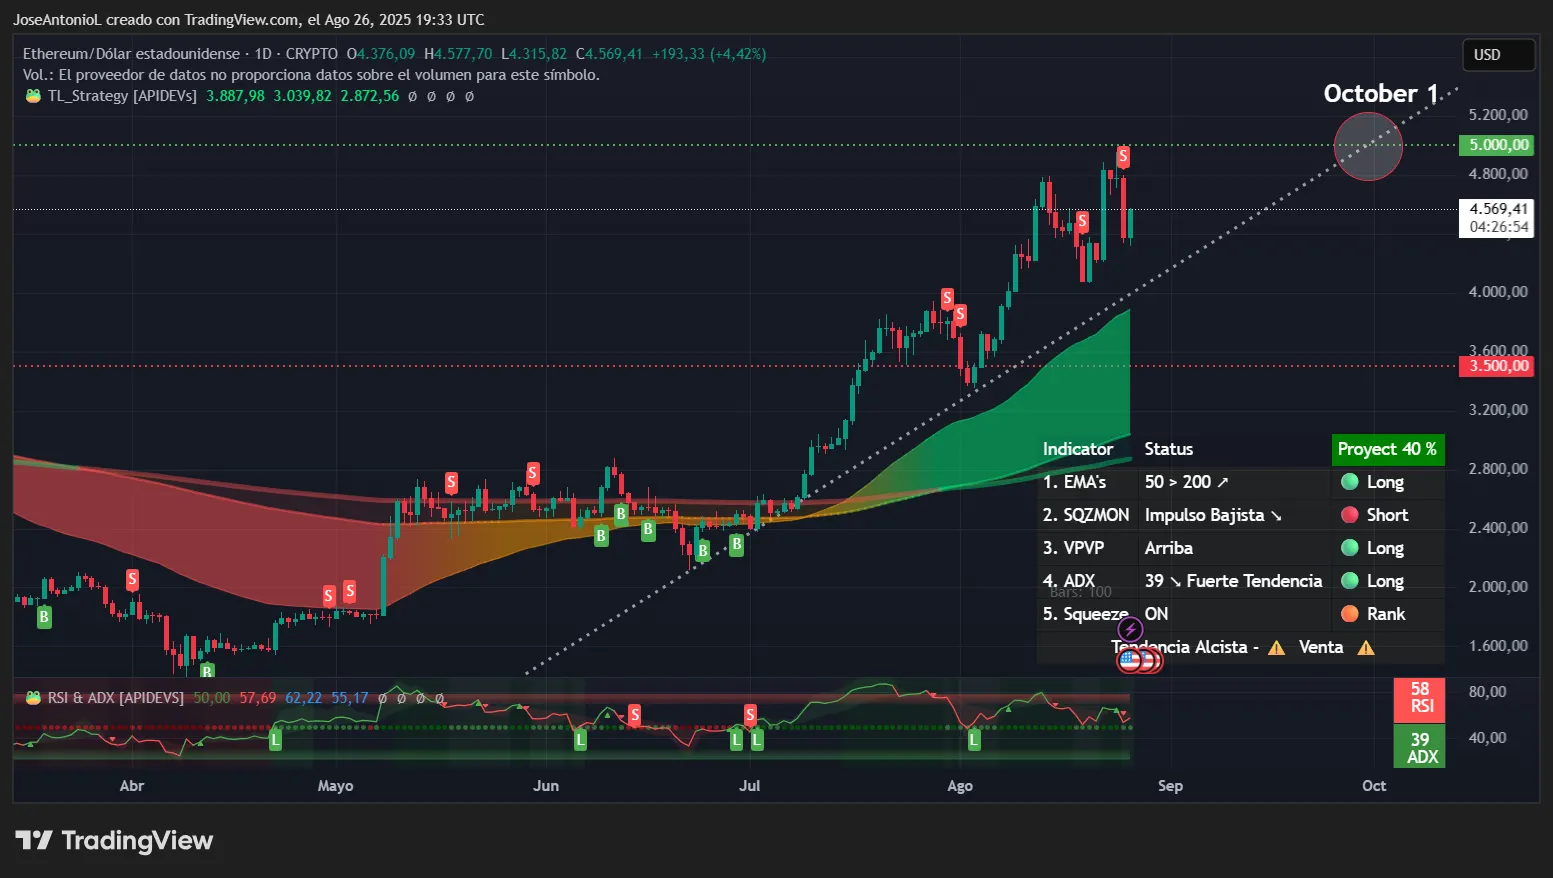
Naturally, when the market leader goes down, other crypto assets follow—and Ethereum was no exception, falling by 10% after briefly hitting an all-time high above $4,900.
But, today, ETH is in the green, and the technical setup is one traders WOULD largely interpret as positive. With ETH likely ending the day in the green, it suggests the overall bullish trend over the long term remains solid despite the brief panic attack.

Among the technical indicators, Ethereum’s Average Directional Index, or ADX, sits at 39, which shows bulls still are in command. The ADX measures trend strength on a scale from 0 to 100, where readings above 25 confirm a strong trend and above 40 indicate extremely powerful momentum. At 39, we're seeing a strong trend, with yesterday’s dip cooling it down from levels above 41 points just a few days ago.
The Relative Strength Index, or RSI, for ETH is currently at 58—which traders would say is the sweet spot for continued gains. RSI measures momentum on a scale of 0-100, with readings above 70 signaling overbought conditions where profit-taking often emerges, and below 30 indicating oversold levels.
At 58, ETH has successfully recovered from oversold conditions without entering dangerously overbought territory, meaning there's still fuel in the tank for further upside before triggering algorithmic selling from traders who use RSI as an exit signal.
And when examining average price supports and resistances, Ethereum’s exponential moving average configuration remains decisively bullish. With the 50-day EMA positioned well above the 200-day EMA, we're seeing a heavy bullish trend in the long run after the golden cross formation last month. This setup typically indicates sustained buying pressure across multiple timeframes and suggests that both short-term momentum traders and long-term position holders are aligned bullishly.
The Squeeze Momentum Indicator shows "on" status, which is particularly significant after yesterday's selloff. This indicator identifies when markets transition from consolidation to trending phases. When it fires "on," it signals that a breakout from consolidation is underway. Combined with today's recovery candle, this suggests caution. Even inside a solid bullish trend, short-term traders could still change direction.
Key levels to watch
Remember, remember: Red September
But bulls may have a strong opponent approaching the ring: history.
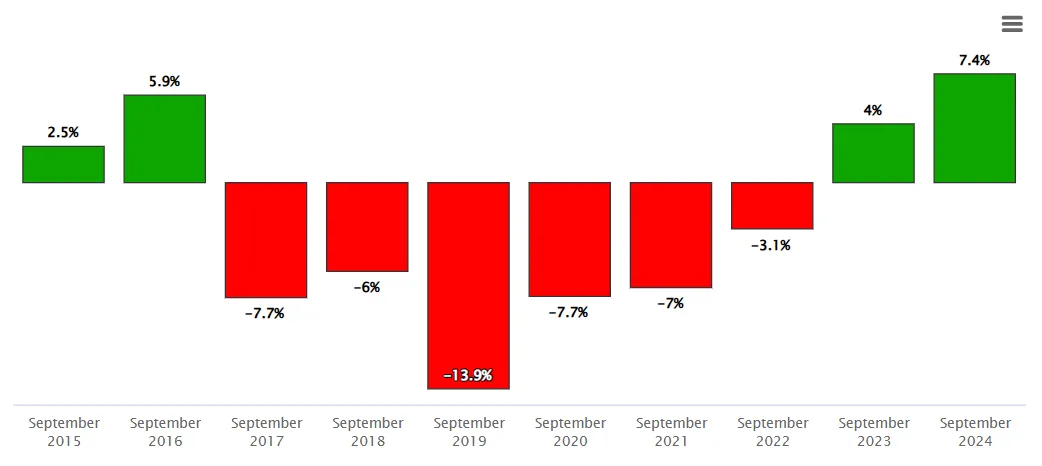
Trading data from 2015 to 2024 shows bitcoin typically underperforms in September, with average returns during the month coming in at -4.89%. During “Red September”—not to be confused with Uptober (which comes right after!)—the price of Bitcoin has dropped by 4.5% on average, making it the worst month of the year for Bitcoin holders.

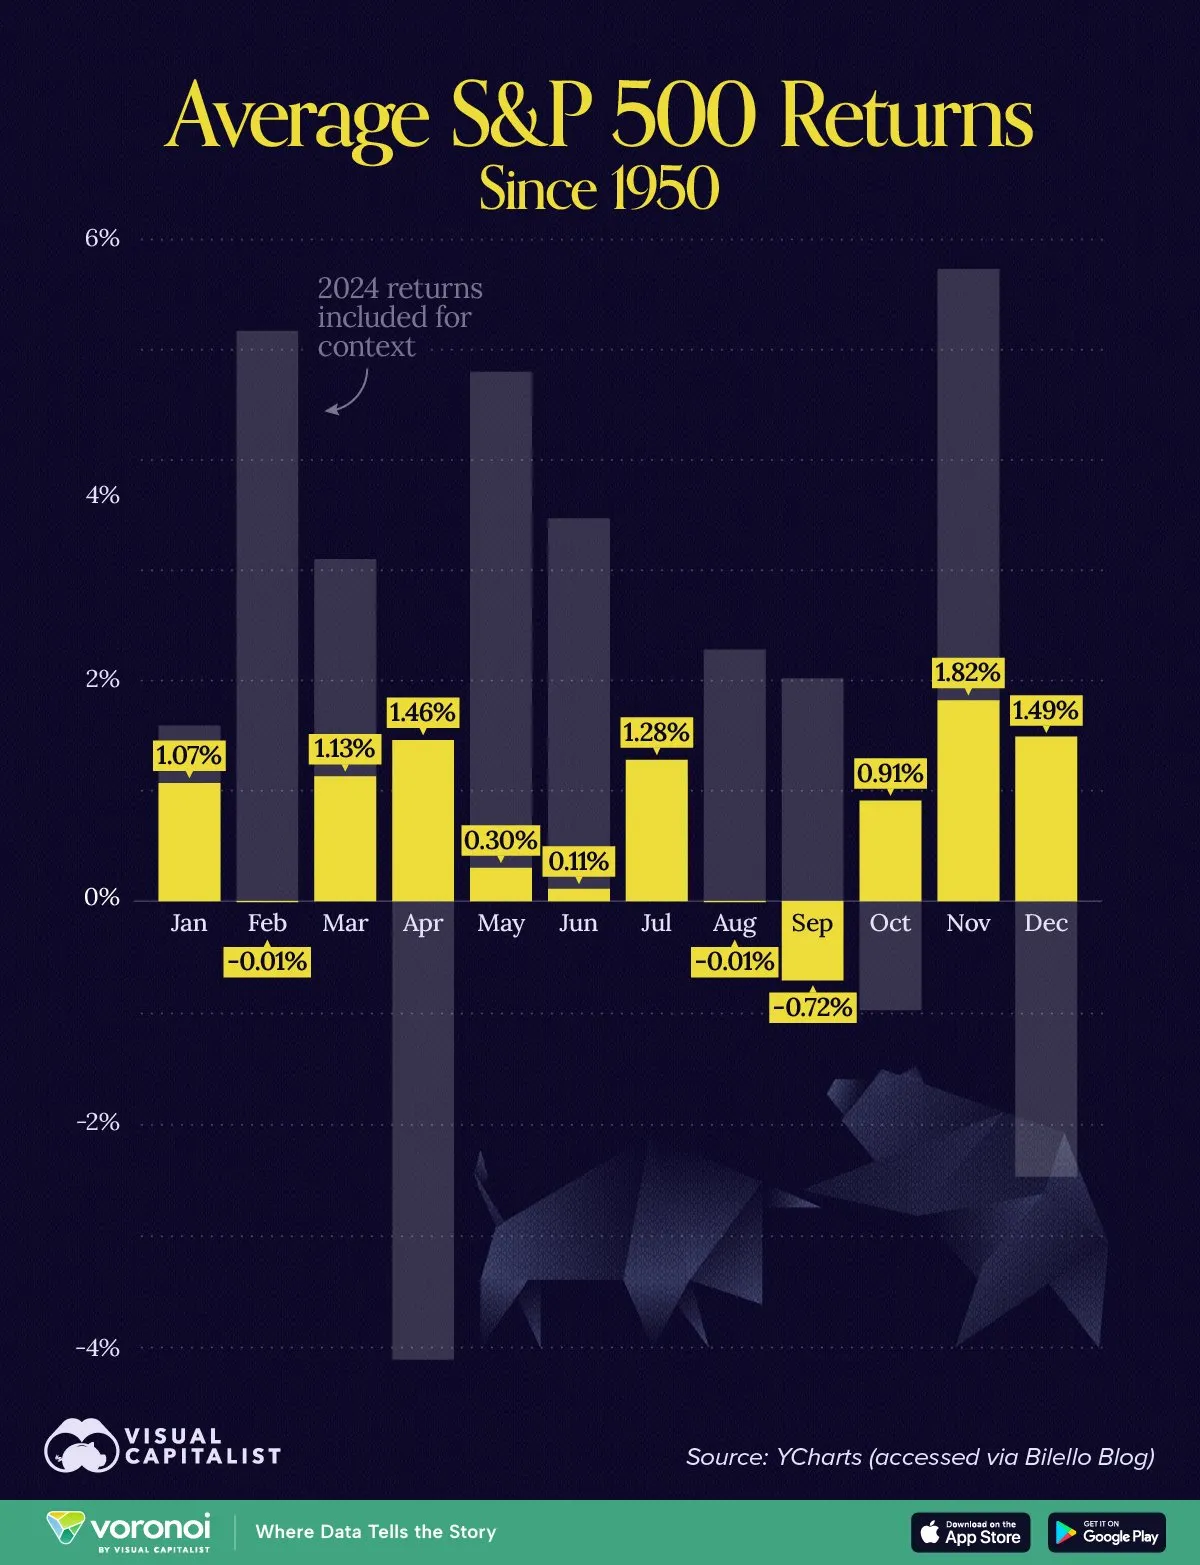
But this isn’t crypto-specific either. For the last 75 years, the stock market has also experienced a pattern in which September tends to be, on average, the worst-performing month of the year.

This historical headwind creates some tension. If the $4,300-$4,500 support holds through what's traditionally crypto's worst month, the technical setup suggests ETH could indeed reach that $5,000 target—potentially as early as October. During “Uptober,” the crypto market has recorded gains of as high as 60% and an average of 22% historically.
If ETH respects the support that triggered its current trend, the natural movement would take it to $5K by October—assuming September isn’t red enough to kill momentum.
At the moment, the technical data supports the bullish view among Myriad traders. The 73% odds on the “moon or dip” market, which asks traders to predict if ETH will moon to $5K or dip to $3.5K, might be a little high based on the available data, but it still lines up.
For the "ETH hits $5K in 2025" market, it’s hard to imagine this not happening in the next four months. October historically brings fireworks, and the current technical setup with RSI at 58 leaves plenty of room for upside. Even if September ends up being rough and ETH repeats the 14% dip of 2019, the drawdown would only test the 50-day EMA support, leaving ETH positioned for an October rally.
Disclaimer
The views and opinions expressed by the author are for informational purposes only and do not constitute financial, investment, or other advice.

