PUMP’s Solana Token Is Surging Again—Will the Rally Hold?

Another day, another Solana memecoin pumping—because apparently, that’s what counts as innovation in crypto now.
PUMP’s latest price surge has traders scrambling, but can it defy gravity? Here’s the breakdown.
The Hype Train Leaves the Station (Again)
After a brutal correction, PUMP’s token is back on its bullshit—jumping double-digits as degenerate traders pile in. Solana’s low fees and high-speed trading make it the perfect playground for these rinse-and-repeat cycles.
Gains or Just Gasoline?
Sure, the charts look juicy now, but let’s not pretend this isn’t the same old game. Memecoins thrive on liquidity waves, not utility. When the music stops—and it always does—the last buyers get the bag.
Pro tip: Watch the trading volume. If it dries up, so does the party.
Bottom Line
Ride the wave if you must, but don’t confuse a memecoin pump with actual investing. After all, even monkeys hit jackpots sometimes.
PUMP price: Bulls defeat the FUD
Pump.fun's remarkable turnaround validates our prior analysis that aggressive buybacks WOULD eventually overwhelm selling pressure and that signs point to a price recovery—or at least heavy pressure against bears.
Pump’s PUMP fell to as low as $0.002283 in late July, well below the ICO price of $.004 when the token launched on July 14. The company raised $600 million after selling out its ICO in just 12 seconds, and the HYPE propelled PUMP to above a $6 billion fully diluted value just days later.
But the hype didn’t last, the price of PUMP soon came tumbling down. The company turned things around for PUMP holders when it announced token buybacks at the end of July just as the token hit bottom, which it has since carried out daily. The company is taking the daily revenue generated from its launchpad and putting it back into the chart, so far buying $23 million worth of PUMP, according to its own figures.
As a result, PUMP is up more than 30% in the last seven days. So what do the charts say now?
The token currently trades at $0.0034 and is approaching a critical broken support NEAR the $0.0035-$0.0040 after the weekly surge. In terms of price direction, the last few days generated respectable bullish support after the token bottomed. Prices have already broken past two resistance levels around the $0.003 and $0.032 marks, which is a good sign for day and swing traders.
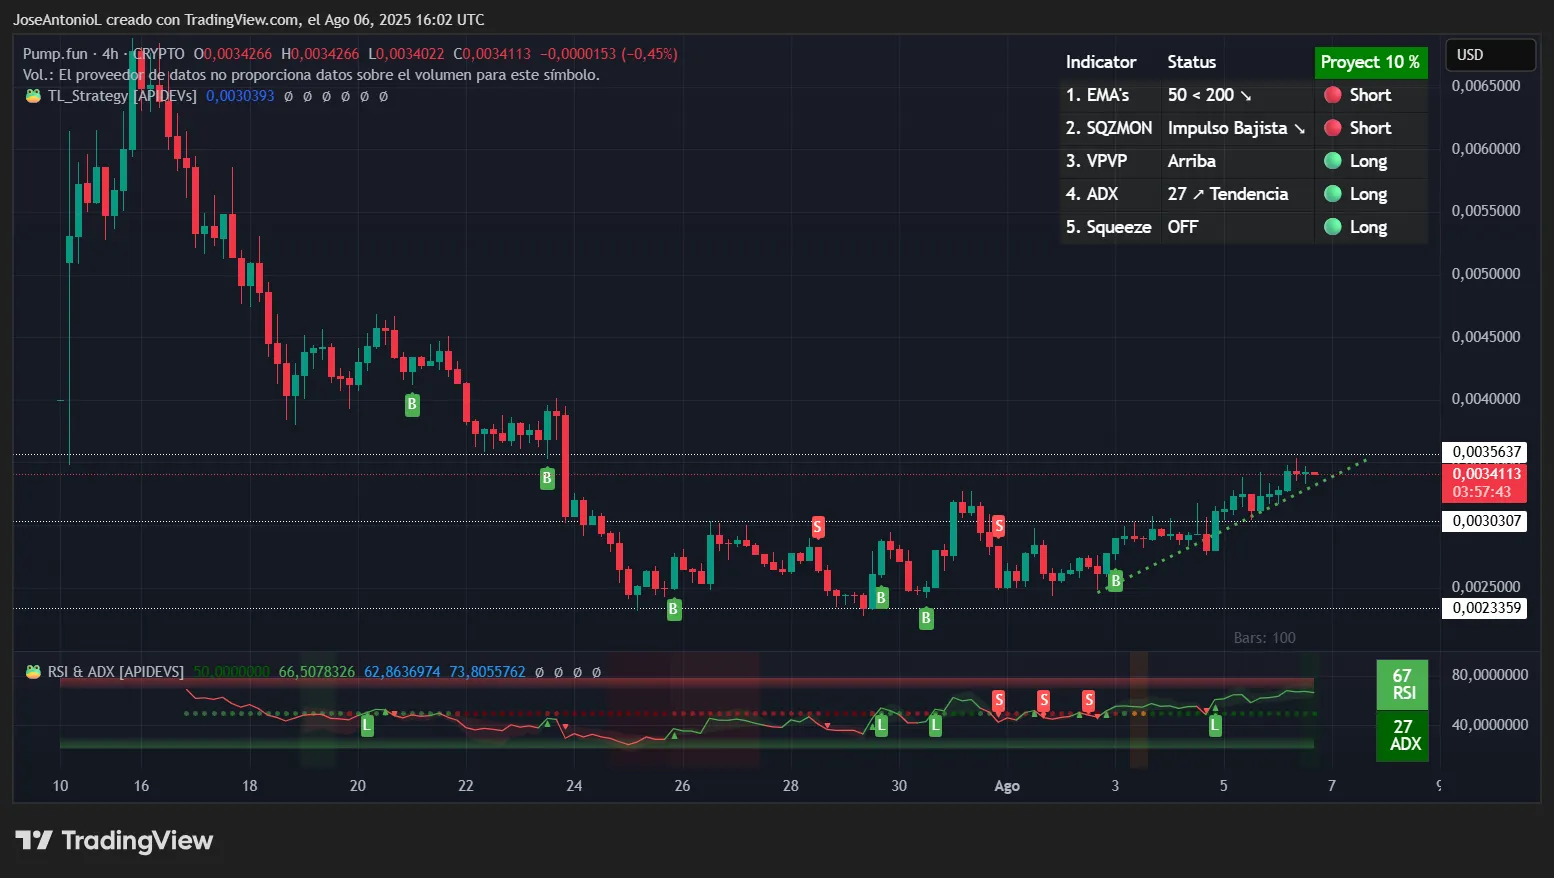
The Relative Strength Index, or RSI, for PUMP sits at 67, approaching but not yet breaching the 70 overbought threshold. For context, RSI measures price momentum on a 0 to 100 scale. Readings above 70 typically signal overextension where profit-taking emerges while below 30 indicates oversold conditions ripe for bounces.
At 67, PUMP shows strong buying pressure without triggering automatic-selling algorithms, suggesting room for PUMP’s pump to grow. Traders would very likely interpret this as particularly bullish given the token's 35% weekly gain hasn't pushed the indicator into dangerous territory.
The Average Directional Index, or ADX, for PUMP is at 27, which marks a very interesting development. ADX measures trend strength regardless of direction. As a general rule, numbers below 20 indicate no trend, 20-25 shows developing momentum, and above 25 confirms established directional movement until prices register 40 points or more, at which point the trend is considered to be very powerful.
PUMP's ADX crossing above 25 signals the bearish correction that drove prices down 47% from May highs is either over or not strong enough to maintain the same bearish direction in case bears remain in play.
The Exponential Moving Averages, or EMAs, for PUMP are also compelling. EMAs measure the average price of an asset over a set period of time. For PUMP, being such a young token, the 4-hour charts are where to look.
The 50-period EMA (the average price of the last week or 50 candlesticks of 4 hours each) currently trades below the 200-period EMA (the average price of the last month, more specifically, 200 candlesticks of 4 hours each), and this is a textbook bearish formation for prices. But the narrowing gap between these averages (considering the prices are finally going up) suggests an impending "golden cross" reversal if prices keep heading in the same direction.
When the faster EMA50 crosses above the slower EMA200, it historically marks the beginning of sustained uptrends. Smart money appears to be front-running this technical milestone.
The coin is not there yet, but the price action can give bull traders some hope.
The Squeeze Momentum Indicator shows “off” status on the 4-hour chart, indicating volatility has already been released from recent compression. This diverges from daily timeframes showing continued squeeze, suggesting different trader cohorts are positioning for the next major move. When multiple timeframes align, explosive price action typically follows.
The indicator currently points to a possible bounce from to the current support, which would not be unexpected considering the price spike. A trader might say it’s a good accumulation zone for those expecting the recovery trend to remain in play for a while longer.
Disclaimer
The views and opinions expressed by the author are for informational purposes only and do not constitute financial, investment, or other advice.
