Bitcoin Holds Steady While This Solana Token Steals the Spotlight: Expert Breakdown

Bitcoin's playing it cool—but one Solana project just hijacked the crypto narrative.
Here's why traders are flipping channels.
The BTC Status Quo
King crypto's range-bound dance continues, frustrating bulls and bears alike. No fireworks—just a $60K-$70K grind that's tighter than a VC's purse strings during a bear market.
SOL's Dark Horse
Meanwhile on Solana: Some obscure token you've never heard of just ripped 300% in a week. Because of course it did—this is crypto, where fundamentals are optional and memes print Lambos.
Why This Matters
Altseason isn't dead—it just moved to smarter chains. While Bitcoin maximalists argue about ETFs, Solana's modular ecosystem keeps shipping actual utility (and the occasional vaporware).
The Bottom Line
BTC remains the reserve asset, but the real action? It's wherever degenerate yield farmers and institutional bagholders collide. Place your bets—just don't mortgage your house this time.
Bitcoin price: The consolidation will continue until…
Bitcoin trading flat today might seem unremarkable, but the technical picture shows a market at a critical juncture. The flagship cryptocurrency's price action reflects a tug-of-war between whale accumulation and profit-taking pressures.
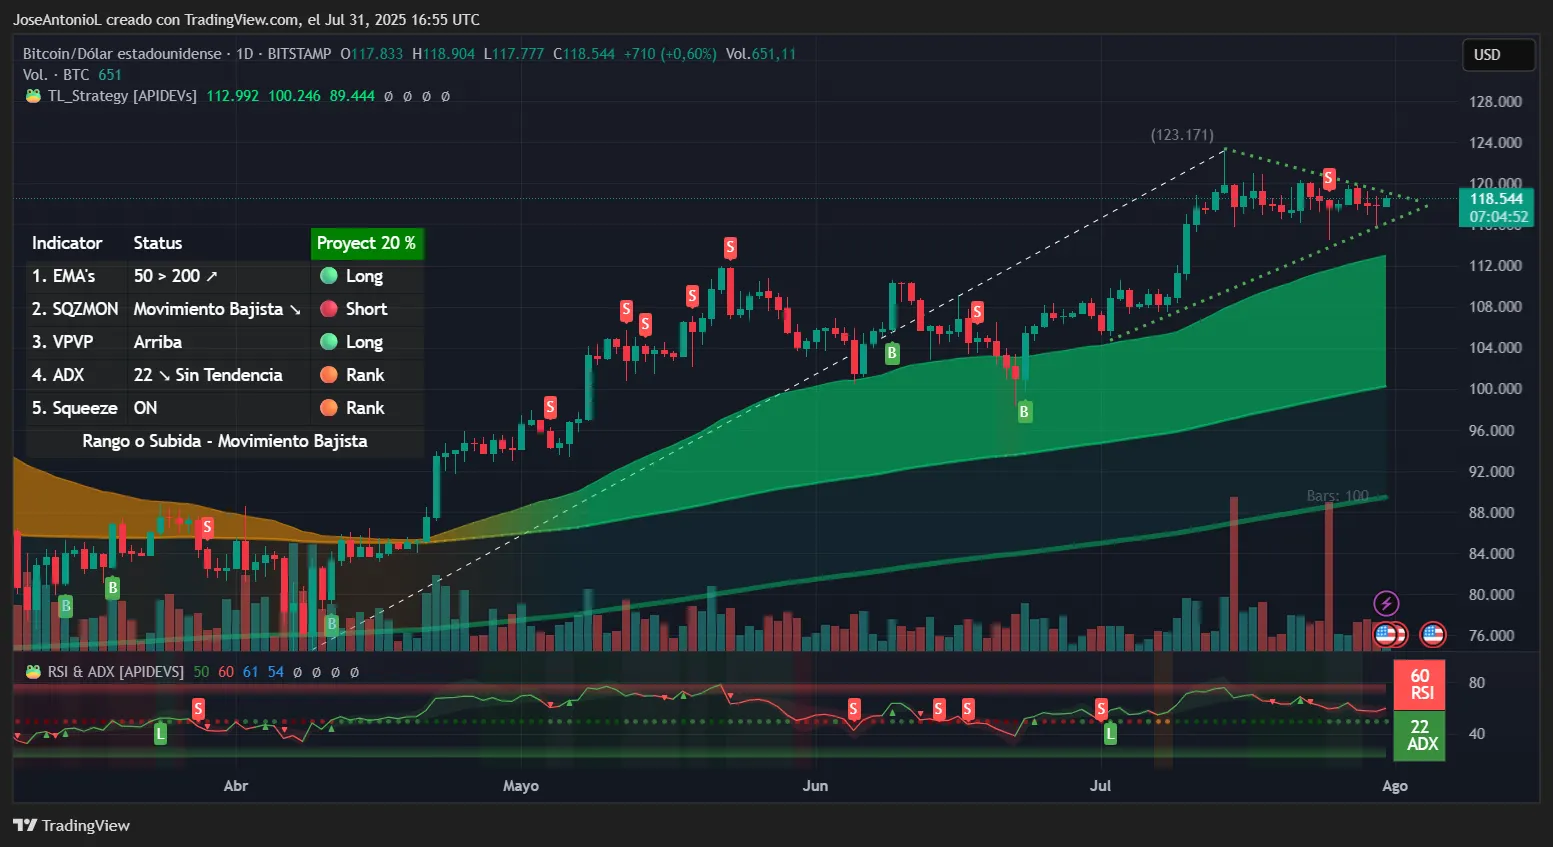
The Relative Strength Index, or RSI, for bitcoin sits at exactly 60, and has been slowing down, showing that markets may be cooling after a pretty steady spike towards a new all-time high not long ago. RSI is like a temperature gauge for markets, measuring how hot an asset might be on a scale from 0 to 100.
An RSI reading of 60 for BTC suggests traders are waiting for a clear directional signal before committing to larger positions. When RSI hovers at this midpoint, it often precedes significant moves in either direction. This can be confirmed after looking at the price pattern, which has been trading sideways for the last two weeks and puts BTC inside a symmetric triangle that is about to be broken.
The Average Directional Index, or ADX, for Bitcoin is at 22. ADX measures trend strength regardless of direction, and a score of 22 confirms the weakening of the bull hype. An ADX below 25 indicates no clear trend is established, suggesting Bitcoin is coiling for a potential breakout. Traders typically view this as a period of accumulation before the next major move.
Exponential Moving Averages, or EMAs, are also handy indicators for traders. EMAs take the average price of an asset over a given period. Bitcoin’s 50-day EMA suggests dynamic support around current levels, while the 200-day EMA sits lower, creating what traders WOULD interpret as a bullish market structure. The Squeeze Momentum Indicator shows the market is “on," indicating volatility compression that often precedes explosive moves—an event that could trigger the breakout outside of the triangle pattern.
Pump’s PUMP pumps as buybacks fuel rally
Now onto today’s big winner: Pump.fun’s PUMP is pumping. The Solana token spiked 18% today, making it the market’s standout performer. Why? Ever heard of stock buybacks? Well, it’s like that, but for crypto.
Pump.fun’s aggressive buyback program is turning heads across the meme coin sector. The project announced it would use 100% of daily platform fees—approximately $2.16 million on July 30—to repurchase PUMP tokens from the market.
PumpFun have pivoted to what seems to be 100% token buybacks.
98% of yesterday's PumpFun / PumpSwap revenue went to buying $PUMP today. pic.twitter.com/RXyqCJEBN9
— Adam (@Adam_Tehc) July 30, 2025
It’s almost certainly what triggered PUMP’s bullish swing—or at the very least what provided PUMP holders enough confidence to prevent prices from dumping even more. This was also enough to make the token go from the worst-performing cryptocurrency in the top 100 to the best-performing coin in today’s otherwise flat and boring market.
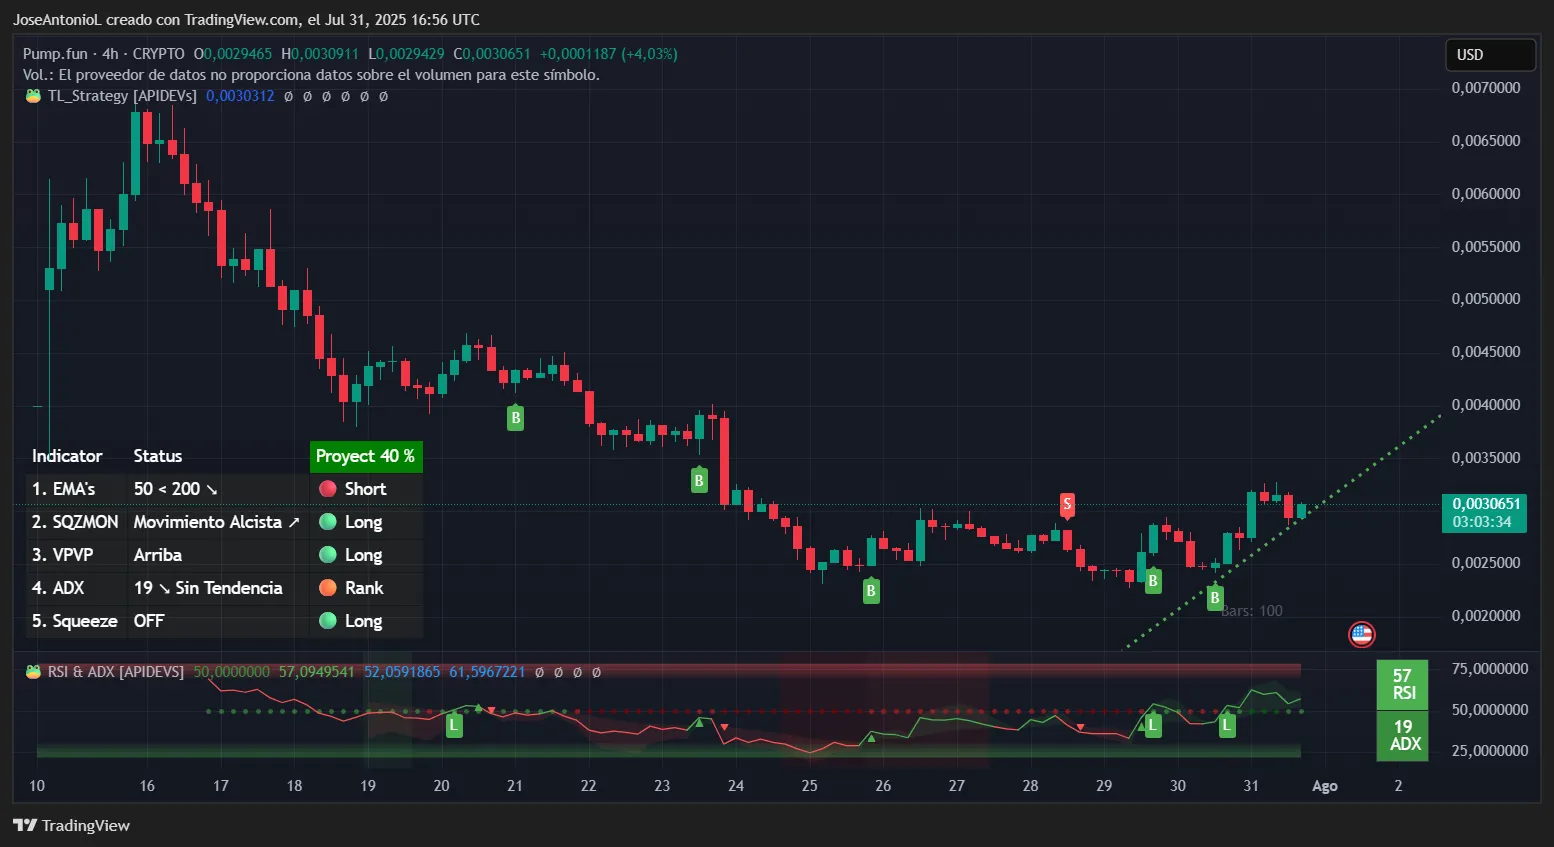
Technical indicators can only be studied in short time frames because the coin is too young for other oscillators to work. However, things point towards a relief rally after a major bearish panic.
In terms of the current price trend, there is support forming that traders would say paints a bullish recovery. The support, though, is still weak, but it has been tested successfully in the last three days. Looking at a broader outlook, the resistance at around its current $0.003 price zone marks a possible ascending triangle about to be tested. Generally speaking, ascending triangles (a flat resistance and an ascending support) tend to be considered a bullish formation.
PUMP’s RSI at 57.09 shows healthy buying momentum without approaching overbought territory above 70. This suggests room for further upside before profit-taking typically kicks in. Traders often target RSI readings between 50-70 as the "sweet spot" for trend continuation. The RSI going up during the latest candlesticks is also a good sign for the bulls—not enough to say markets are bullish, but probably interesting enough to set up buy orders.
The ADX at 19 indicates a weak trend, but context is crucial here: PUMP is emerging from a severe downtrend that saw it drop 62% from its peaks. Low ADX readings after extended declines often signal the early stages of reversal, particularly when accompanied by volume spikes like today's 25.68% increase to $683.9 million.
So what does that mean? Basically, bearish dominance is slowing down, but also current bullish behavior doesn’t necessarily suggest number go up in the short term. Only that number has stopped going down—for now.
PUMP did, however, break above a descending resistance line that had capped rallies for two weeks. This technical breakout, combined with the fundamental catalyst of buybacks, typically attracts momentum traders.
Buybacks are bullish, what can we say. So long as the one doing the buying back has DEEP enough bags to keep it going.
