Hyperliquid’s $69.69 Target Before September: Why Bulls Should Brace for Impact

Hyperliquid's rally faces a brutal reality check as the $69.69 target looms. Market sentiment? Not exactly bullish.
### The September Countdown Begins
Traders betting on a Hyperliquid surge might want to check their optimism at the door. The numbers don't lie—this isn't a chart for the faint-hearted.
### Liquidity or Liquidation?
With less than six weeks until September, the odds stack higher than a leveraged long position. And we all know how those usually end.
### The Cynic's Corner
Another 'sure thing' in crypto? How refreshing. At least the exit scams are getting more creative.
HYPE’s path to $69.69
Eyenovia can wait for HYPE to moon, but the predictors on Myriad Markets cannot. The market closes on August 31, 2025, at 11:59 PM UTC—the vertical WHITE line in the chart below.
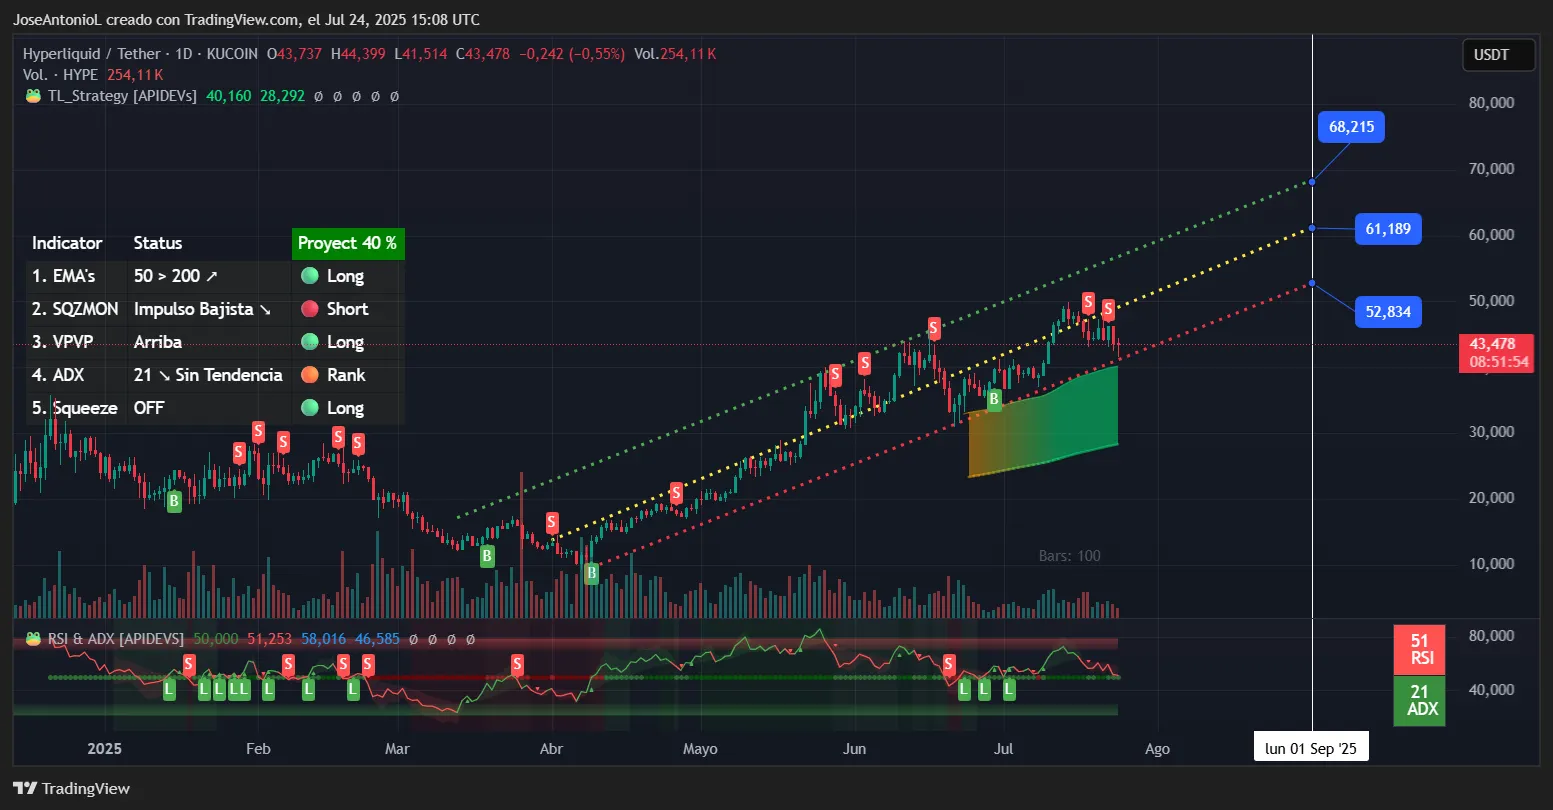
The daily chart reveals HYPE trading within a well-defined ascending channel that has contained price action since early 2025. Currently at $43.478, the token WOULD need to rally approximately 60% to reach the $69.69 target—a significant but not unprecedented move in crypto markets.
The broader technical landscape offers additional insights into HYPE's momentum:
The Relative Strength Index, or RSI, at 51 indicates neutral momentum—neither overbought nor oversold. Think of RSI as a thermometer that measures how hot a market might be. This middle-ground reading suggests the token has room to run higher without immediate selling pressure, but lacks the explosive buying momentum typically seen before major rallies. Traders often view RSI readings between 30-70 as a consolidation zone where accumulation occurs before the next directional move.
This means the current speed and momentum is enough to keep markets at some level of equilibrium, which itself means the trend may keep up its pace if all other conditions remain the same.
The Average Directional Index, or ADX, at 21, however, reveals a weakening trend strength. The ADX measures how strong a price trend is regardless of direction—readings below 25 indicate a weak trend, while numbers above 25 confirm a trend has been established.
Low ADX readings after a strong MOVE often indicate consolidation before the next leg higher. This suggests HYPE may be gathering energy for its next move rather than maintaining the aggressive pace needed for a 60% rally in the very near term.
Also, traders could easily interpret this to mean that HYPE is about to enter a consolidation zone before a bearish correction, as its upward momentum loses strength. Traders who study charts would likely opt to read the ADX alongside other oscillators like the Squeeze Momentum Indicator to reach more accurate conclusions.
As for HYPE’s Exponential Moving Averages, the average price of the previous days, they show what traders would interpret as a bullish configuration. The 50-day EMA, the average price of HYPE over the last 50 days, is positioned above the 200-day EMA—a classic bullish formation. This alignment typically indicates sustained buying pressure and suggests the longer-term trend remains positive. However, the gap between these averages is relatively narrow. The token, though, is relatively new, with less than a year in the markets, so EMAs alone may not be good enough to read and time the markets.
The "off" status in the Squeeze Momentum Indicator suggests volatility has been released and the market is in a compression phase, proving the thesis of a weakening bull trend reading as measured by the low ADX. This indicator helps identify periods when Bollinger Bands contract, often preceding significant price movements. The current reading implies a breakout—in either direction—may be forming, but in the immediate time frame, prices may move slowly.
And that’s not good for predictors betting on a 60% spike happening in a few weeks.
In terms of just price behavior, though, HYPE has been trading inside a bullish channel since April 2025. This means it has been going through higher lows every time it dips and higher jumps every time it peaks.
However, based on the channel dynamics, three scenarios emerge with bullish outcomes:
If HYPE respects only the lower channel support (red line), the price could reach approximately $52-55 by September, falling short of the target.
Should the token find equilibrium at the mid-channel resistance (yellow line))—which has also acted as support during the current trend—HYPE could reach $58-62 by September, still below the coveted $69.69.
Even in the most optimistic case where HYPE hugs the upper channel resistance (green line), projections suggest the price would reach approximately $65-68 by September—very close but likely just shy of $69.69.
In other words, the charts would say it’s very unlikely the token trades at $69.69 before September. To hit that mark, the token would need to not only maintain its channel trajectory but accelerate beyond historical patterns—requiring significant catalysts or a broader crypto market rally.
But, hey, it’s crypto—almost anything can happen.
:
Disclaimer
The views and opinions expressed by the author are for informational purposes only and do not constitute financial, investment, or other advice.
