Is Bitcoin’s Bull Run Over After Hitting $124,200 Peak?

Bitcoin smashes through records—then hits the brakes. The king of crypto just touched $124,200, sending shockwaves across trading floors and Twitter feeds alike.
Market Whiplash: Euphoria to Uncertainty
Traders scramble as volatility spikes. Momentum swings wild—classic crypto theater. Everyone’s asking the same thing: Is this the top, or just a breather?
Institutional Players Hold Their Ground
Big money isn’t flinching. Hedge funds and corporate treasuries keep stacking sats, betting long-term on digital gold. Meanwhile, retail FOMO kicks in—latecomers rushing in near peaks, as always.
Regulatory Shadows Loom
Governments sharpen their knives. Another round of talk about crackdowns, taxes, and compliance. Because nothing says 'innovation' like a 40-page regulatory filing.
What’s Next? Correction or Continuation?
History says pullbacks are healthy—even necessary. But this cycle feels different. Adoption’s broader, infrastructure’s stronger, and frankly, the traditional financial system still looks like a rented mule compared to a decentralized network.
So—bull run over? Or just getting warmed up? One thing’s certain: in crypto, the only constant is drama.
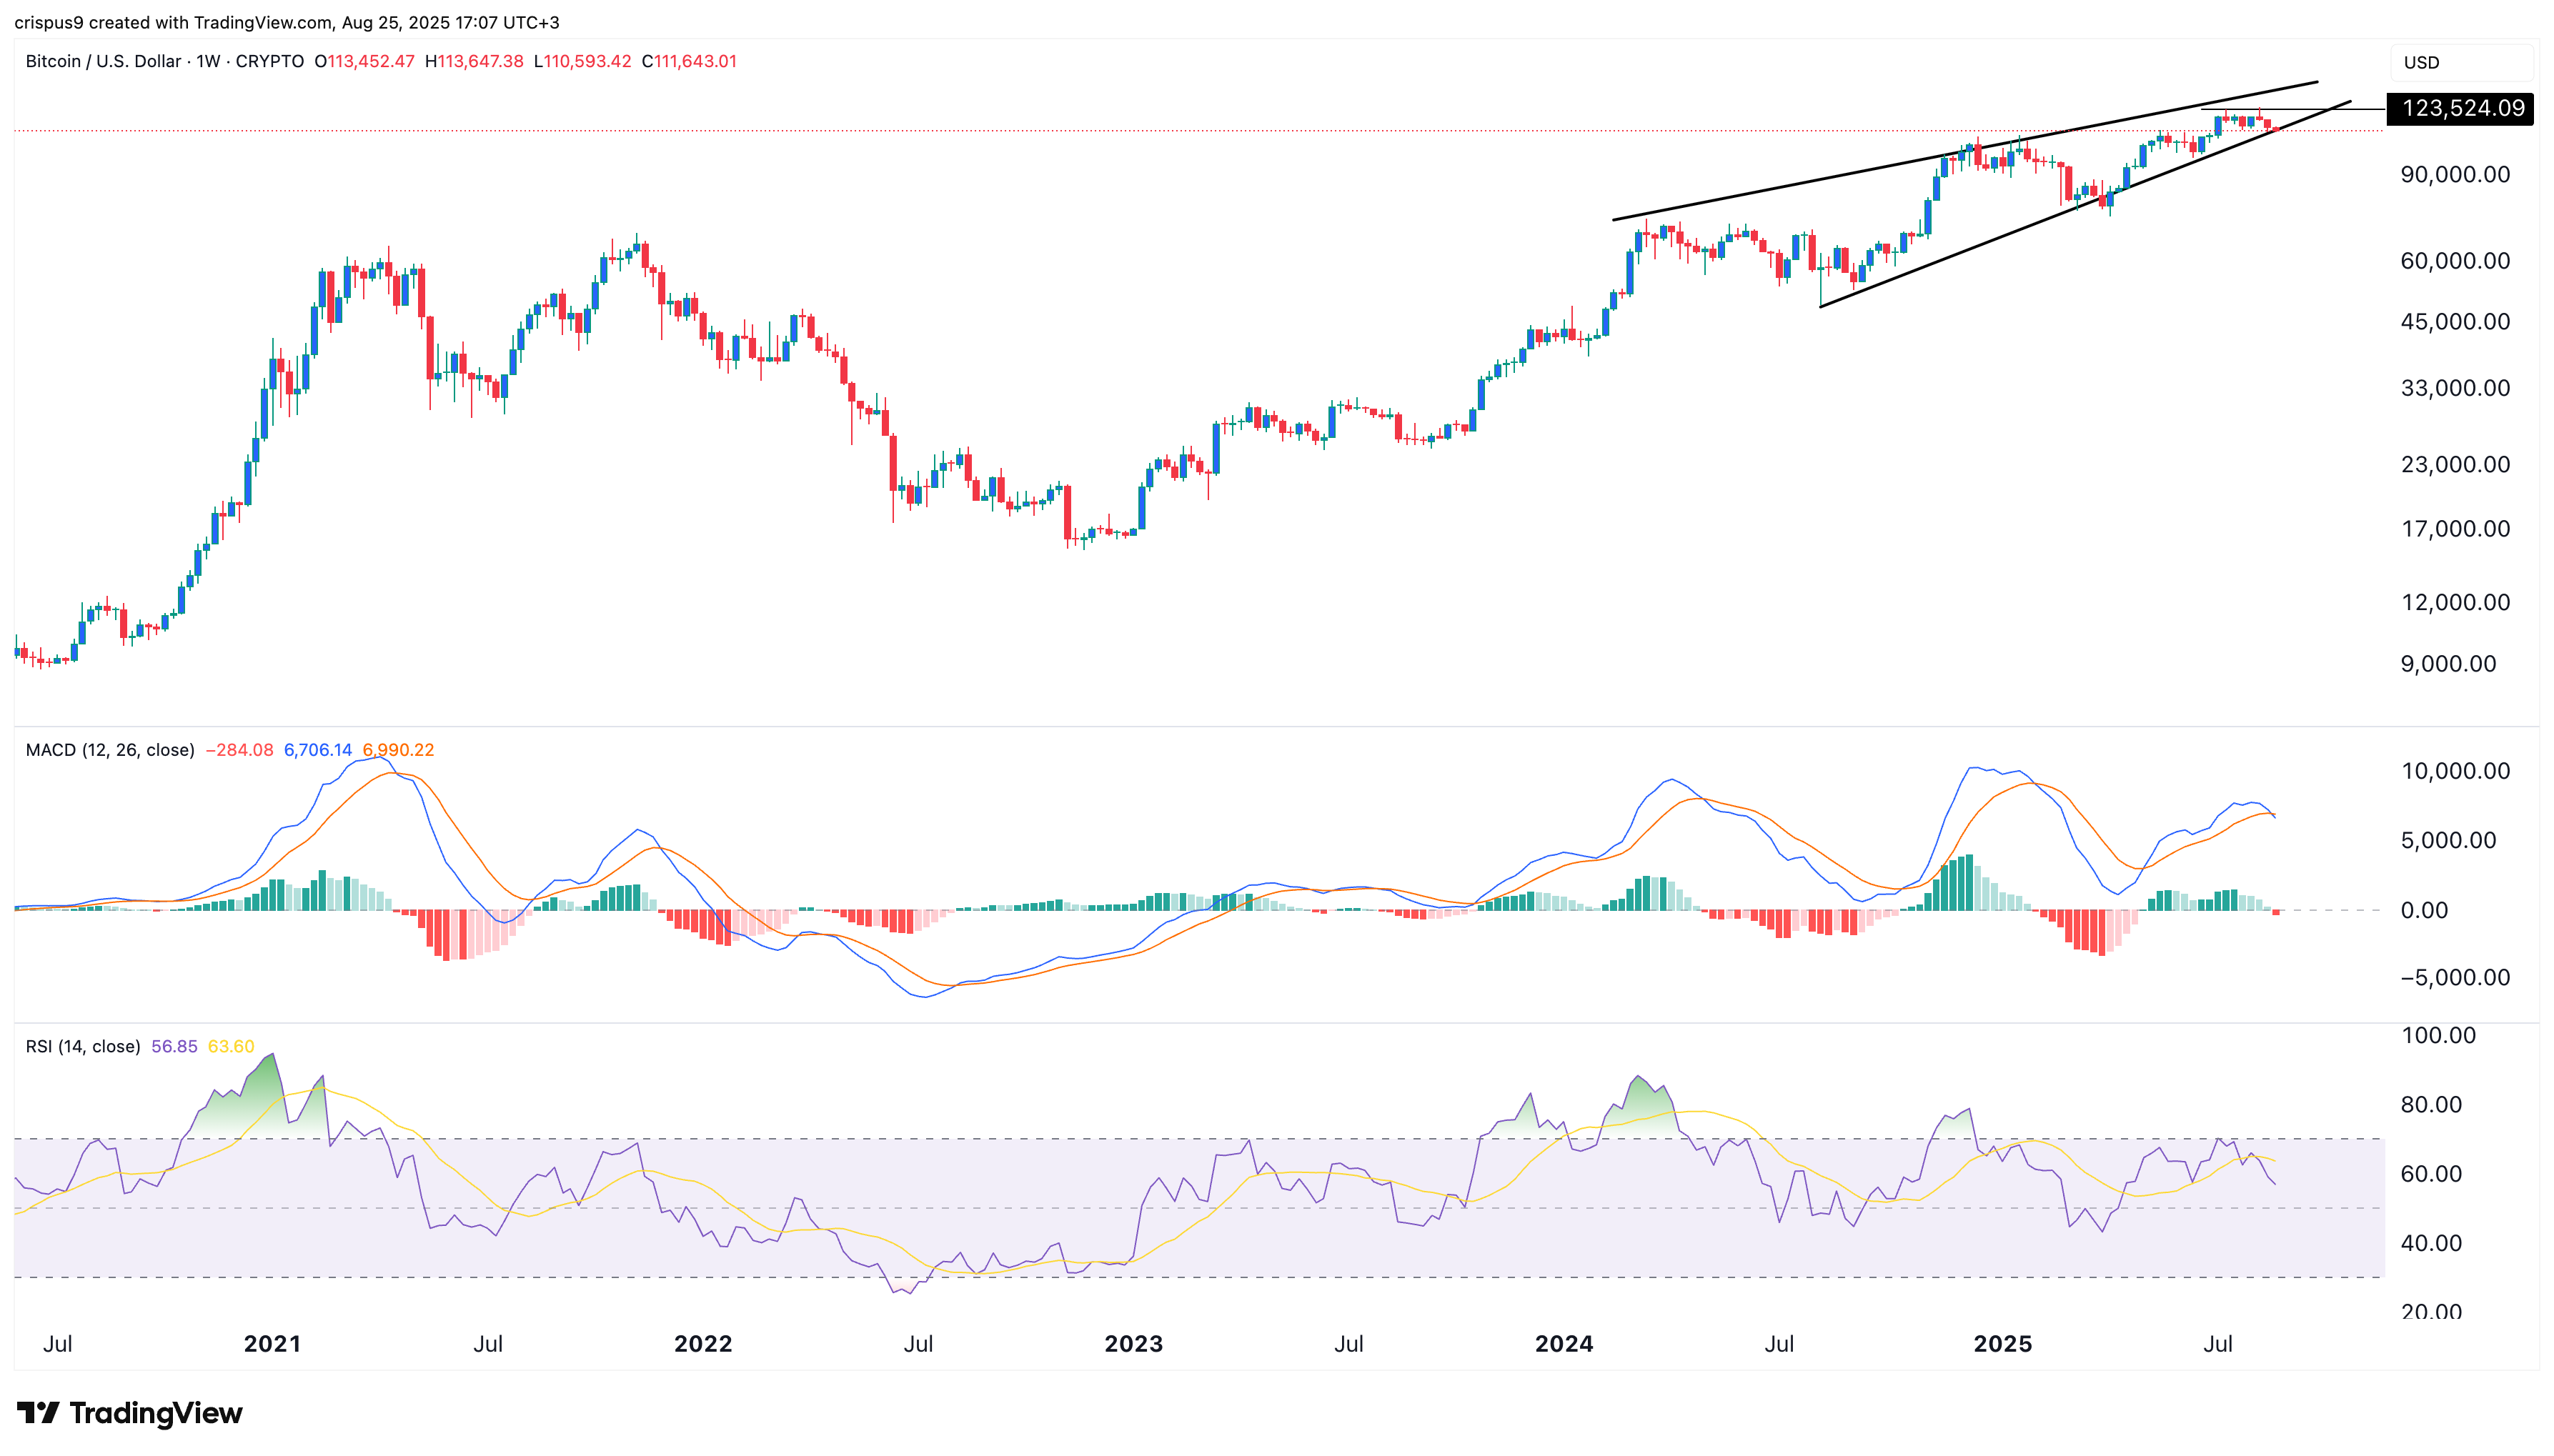
Weekly chart hints that the Bitcoin bull run may be over
The weekly chart below shows that the BTC price has been in a prolonged bull run in the past few years. It bottomed at $15,463 in late 2022 after the FTX implosion and then peaked at an all-time high of $124,200.
A closer look shows that the Bitcoin price has slowly formed the highly bearish rising wedge chart pattern on the weekly chart.
This pattern comprises two ascending and converging trendlines. The upper one connects the higher highs since March last year, while the lower one links the lower highs since August last year.
These two lines are nearing their convergence, which is where bearish breakouts happen.
Additionally, the bitcoin price has formed a bearish divergence pattern, which happens when an asset is rising while the top oscillators are moving downwards.
In this case, the Percentage Price Oscillator, which is a modified MACD, has formed a series of lower highs and is nearing the zero line.
Similarly, the Relative Strength Index has moved from a high of 87.7 in February 2024 to 56 today. This divergence is shown in the descending trendline that connects the highest swings in February and November last year, and this month.
Meanwhile, the accumulation and distribution indicator has flattened, which is a sign that it has moved from the accumulation phase.
Therefore, the bitcoin price will likely have a strong bearish breakdown in the coming days. Such a sell-off could see it drop to the 50-week moving average at $95,000.
Bitcoin ETF inflows are slowing
More data shows that Bitcoin ETF demand has waned in the past few weeks, a sign that institutional investors are not buying as aggressively as they did in the past.
SoSoValue data shows that spot Bitcoin ETFs had over $1.17 billion in outflows last week, much higher than the $547 million inflows they had in the previous week.
More data from CoinGlass shows that the amount of Bitcoin held on exchanges has started ticking up in the past few days. There are now 2.25 million coins, the highest level since Aug. 7. Rising exchange balances are a sign that investors are selling their coins.
