Monero Smashes Into Key Resistance—Why $269 Could Spark the Next Bull Run

Monero's grinding its gears against a stubborn price ceiling—but crypto traders know the drill. When privacy coins hit resistance, they either break hard or bounce harder. Here's why $269 is the magic number.
The Setup: A Textbook Bullish Reversal Play
Technical analysts are eyeing Monero's chart like hawks. That $269 level isn't just psychological support—it's the launchpad for three historic rallies. Break past it, and the FOMO floodgates swing wide open.
Why This Time Might (Actually) Be Different
Unlike your average meme coin, Monero's got fundamentals: real privacy tech, a rabid community, and regulators sweating bullets. If Bitcoin's the digital gold, XMR's the offshore numbered account—and Wall Street's still figuring out how to tax it.
The Bottom Line
Watch $269 like it's the last lifeboat off the Titanic. Breakthrough = moonshot. Rejection? Another day in crypto's endless cycle of hope and despair. Either way, grab popcorn—this is finance without the suits.
Key Technical Points
- Value Area High & 0.618 Fibonacci Resistance: Price is testing this confluence zone, increasing the likelihood of short-term rejection.
- Support Cluster at $269: Value area low, 0.618 Fib, and 200 MA converge here, a critical area for potential bullish reversal.
- Next Target at $417: High time frame resistance and prior swing high that serves as the upper boundary of the range.
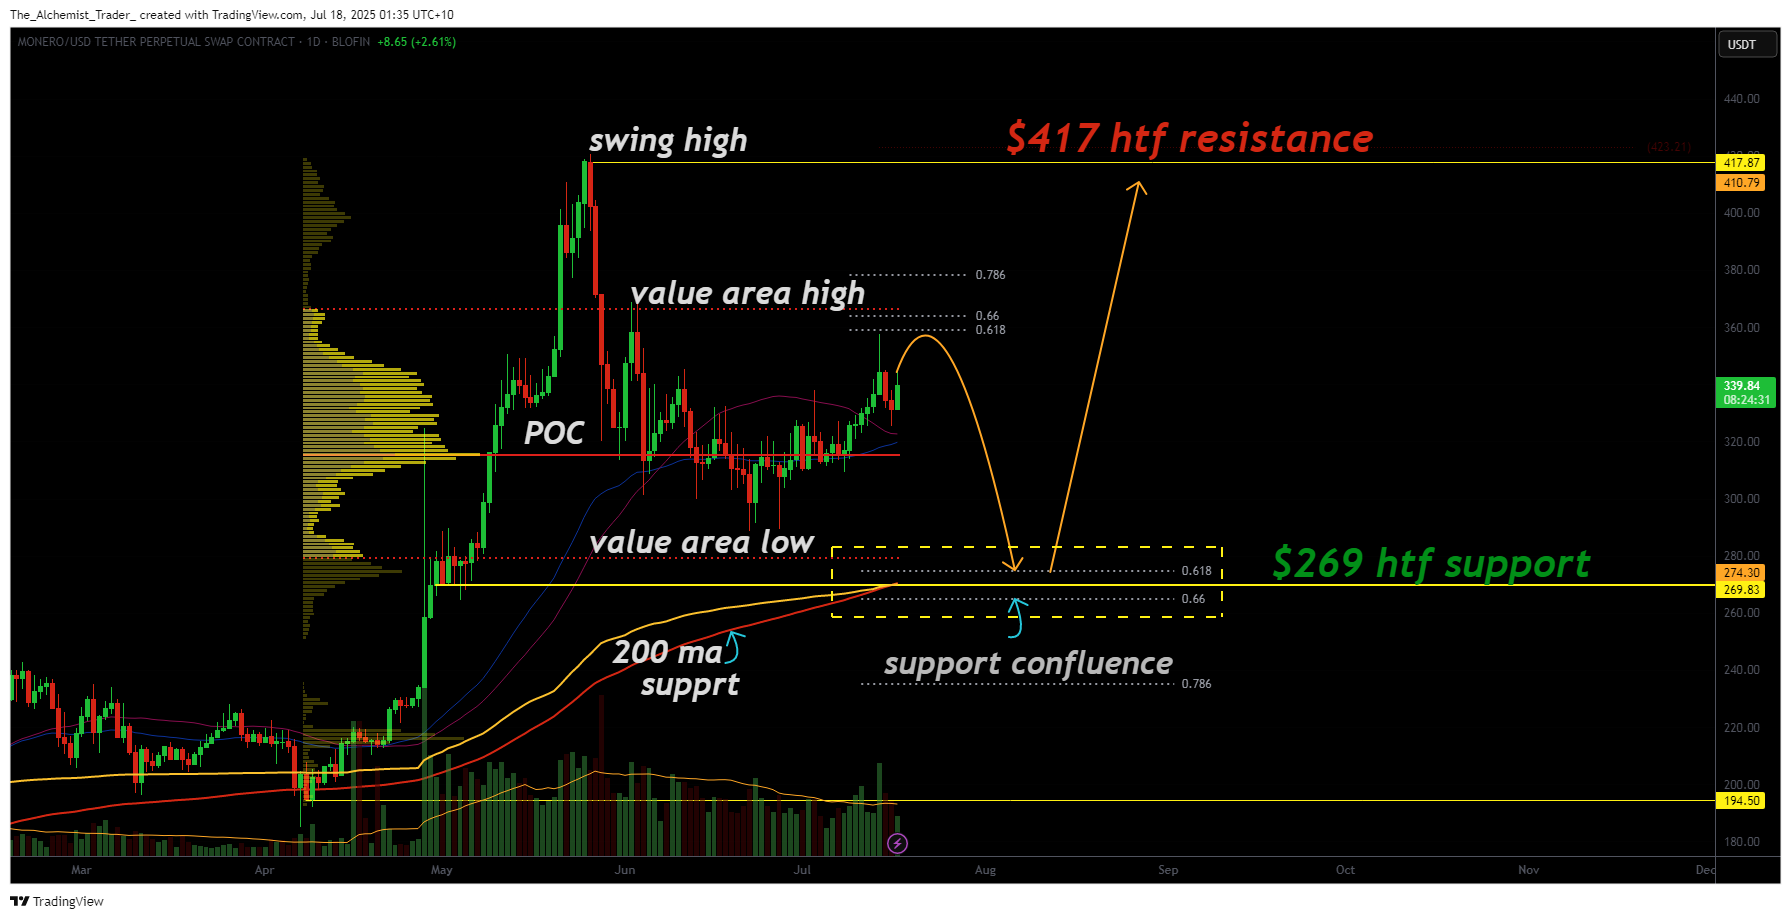
Monero is trading inside a clear volume-defined range, bounded by the value area low near $269 and the value area high, which is currently being tested. This resistance zone also aligns with the 0.618 Fibonacci retracement, making it a key area where price may face rejection in the short term.
A rejection from this confluence region WOULD not be considered bearish, rather, it would be seen as a healthy corrective move, particularly in the context of a range-bound market. If a pullback occurs, price is likely to target the $269 support zone, where multiple technical factors converge: the 200-day moving average, value area low, and the lower Fibonacci retracement. This clustering of indicators creates a high-probability demand zone where a strong bullish reaction can be expected.
From there, Monero could establish a higher low, setting up a rotation back toward the highs. This would keep the trading range intact while offering significant swing opportunities due to the large distance between the support and resistance levels.
The next major upside target remains $417, the high time frame resistance and previous swing high. If the bounce from $269 is strong and supported by volume, this level becomes a realistic objective over the coming weeks.
What to expect in the coming price action
If Monero rejects from the current resistance, look for a corrective MOVE to the $269 support. This level is loaded with confluence and could mark the next bullish reversal zone. If support holds, a rally toward $417 is likely, continuing the broader range oscillation pattern that defines Monero’s current market structure.
