Solana’s Rally Hits Speed Bump as ETF Money Floods In—Wall Street Late Again?

SOL’s meteoric rise pauses just as institutional cash starts chasing the hype. Classic case of ’buy high’ from the suits.
Price action stumbles while ETF inflows spike—retail traders left wondering if the smart money missed the memo or just the exit ramp.
Technical indicators flash caution, but with SOL’s ecosystem firing on all cylinders, this might be Wall Street’s usual fashionably late entrance.
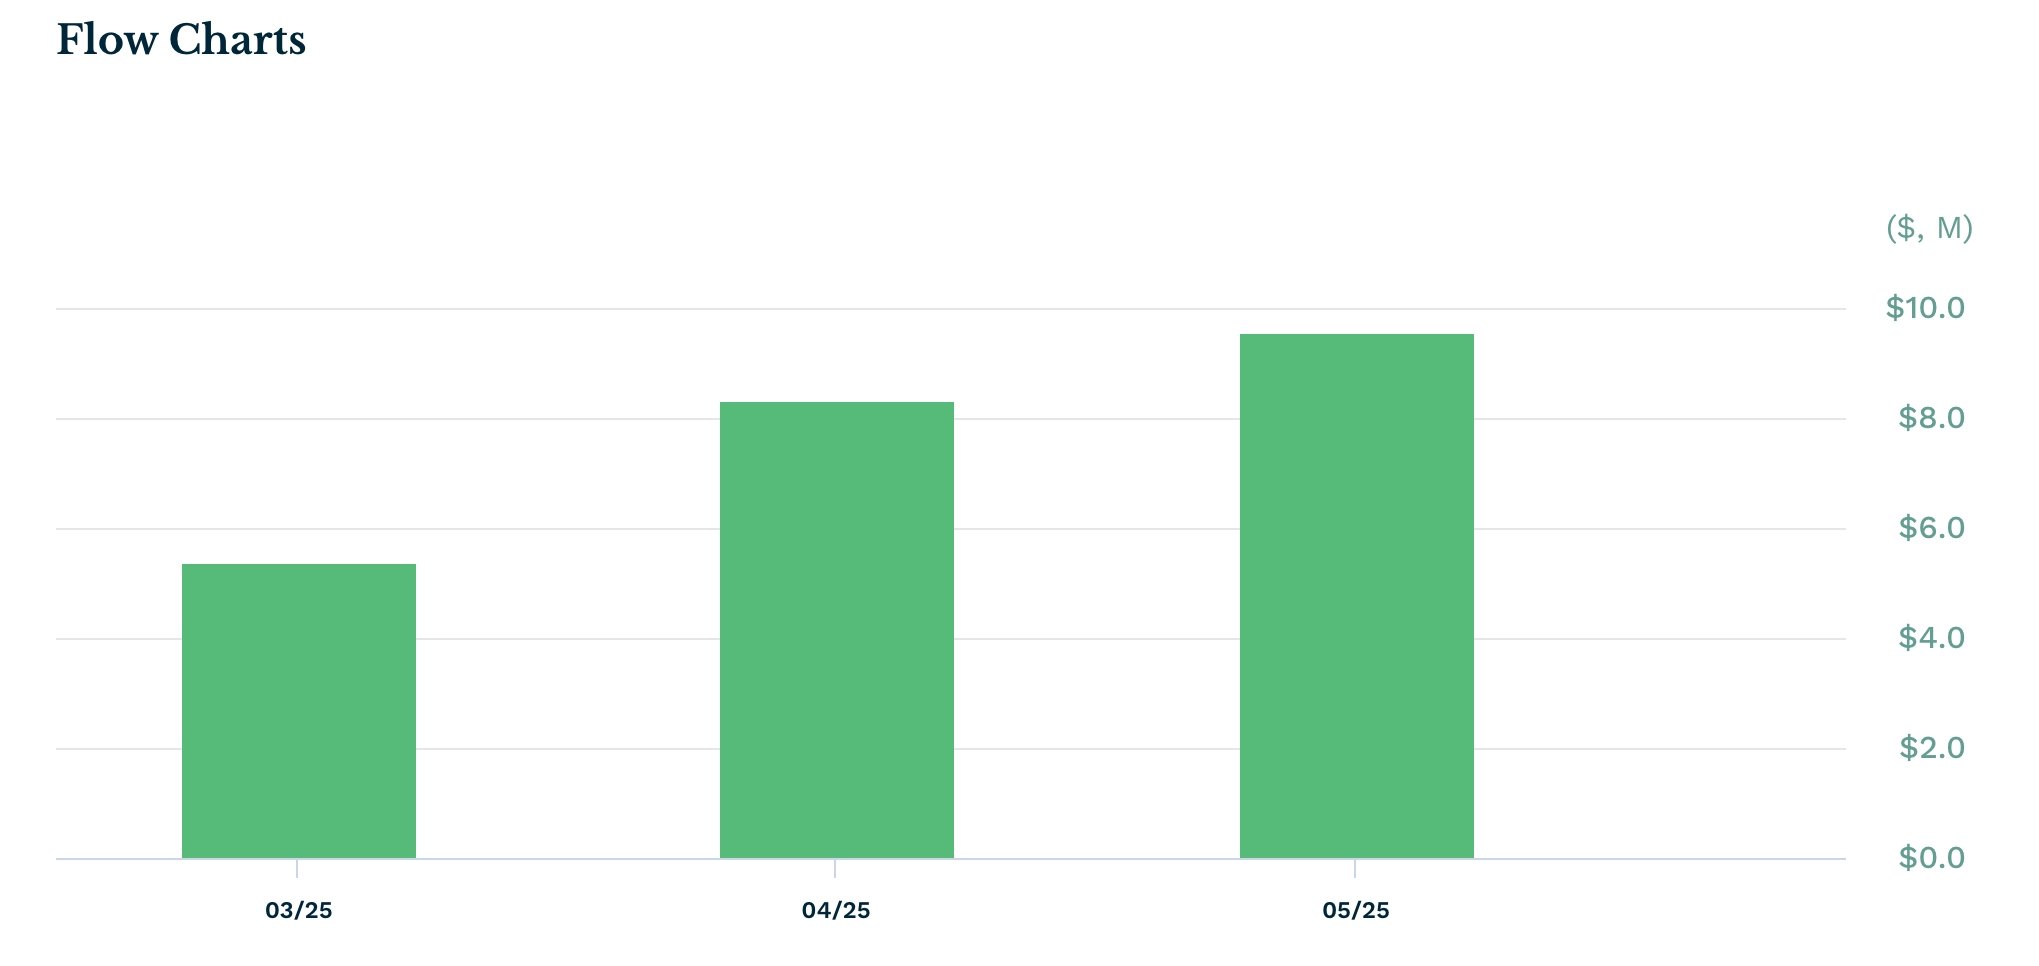 SOLT ETF | Source: ETF
The SOLT ETF aims to generate daily returns that correspond to 2x the daily performance of SOL. It is similar to other leveraged funds like the ProShares UltraPro QQQ and Direxion Daily S&P 500 Bull ETFs, which have $25 billion and $5 billion in assets under management, respectively.
However, the SOLT ETF is relatively expensive, with an expense ratio of 1.85%. By contrast, most stock-based leveraged ETFs charge under 0.90% annually. These ongoing inflows suggest that spot Solana ETFs, which are expected to have lower fees, could see even higher demand from institutional investors.
There are also signs that spot XRP ETFs will have a higher demand than those tracking SOL as the recently-launched XXRP ETF has gained over $106 million in assets.
Beyond ETFs, Solana is benefiting from strong network fundamentals. The number of transactions and active accounts has surged in 2025. Over the past 30 days, transactions ROSE by 66%, while active accounts climbed to 101 million.
Solana price technical analysis
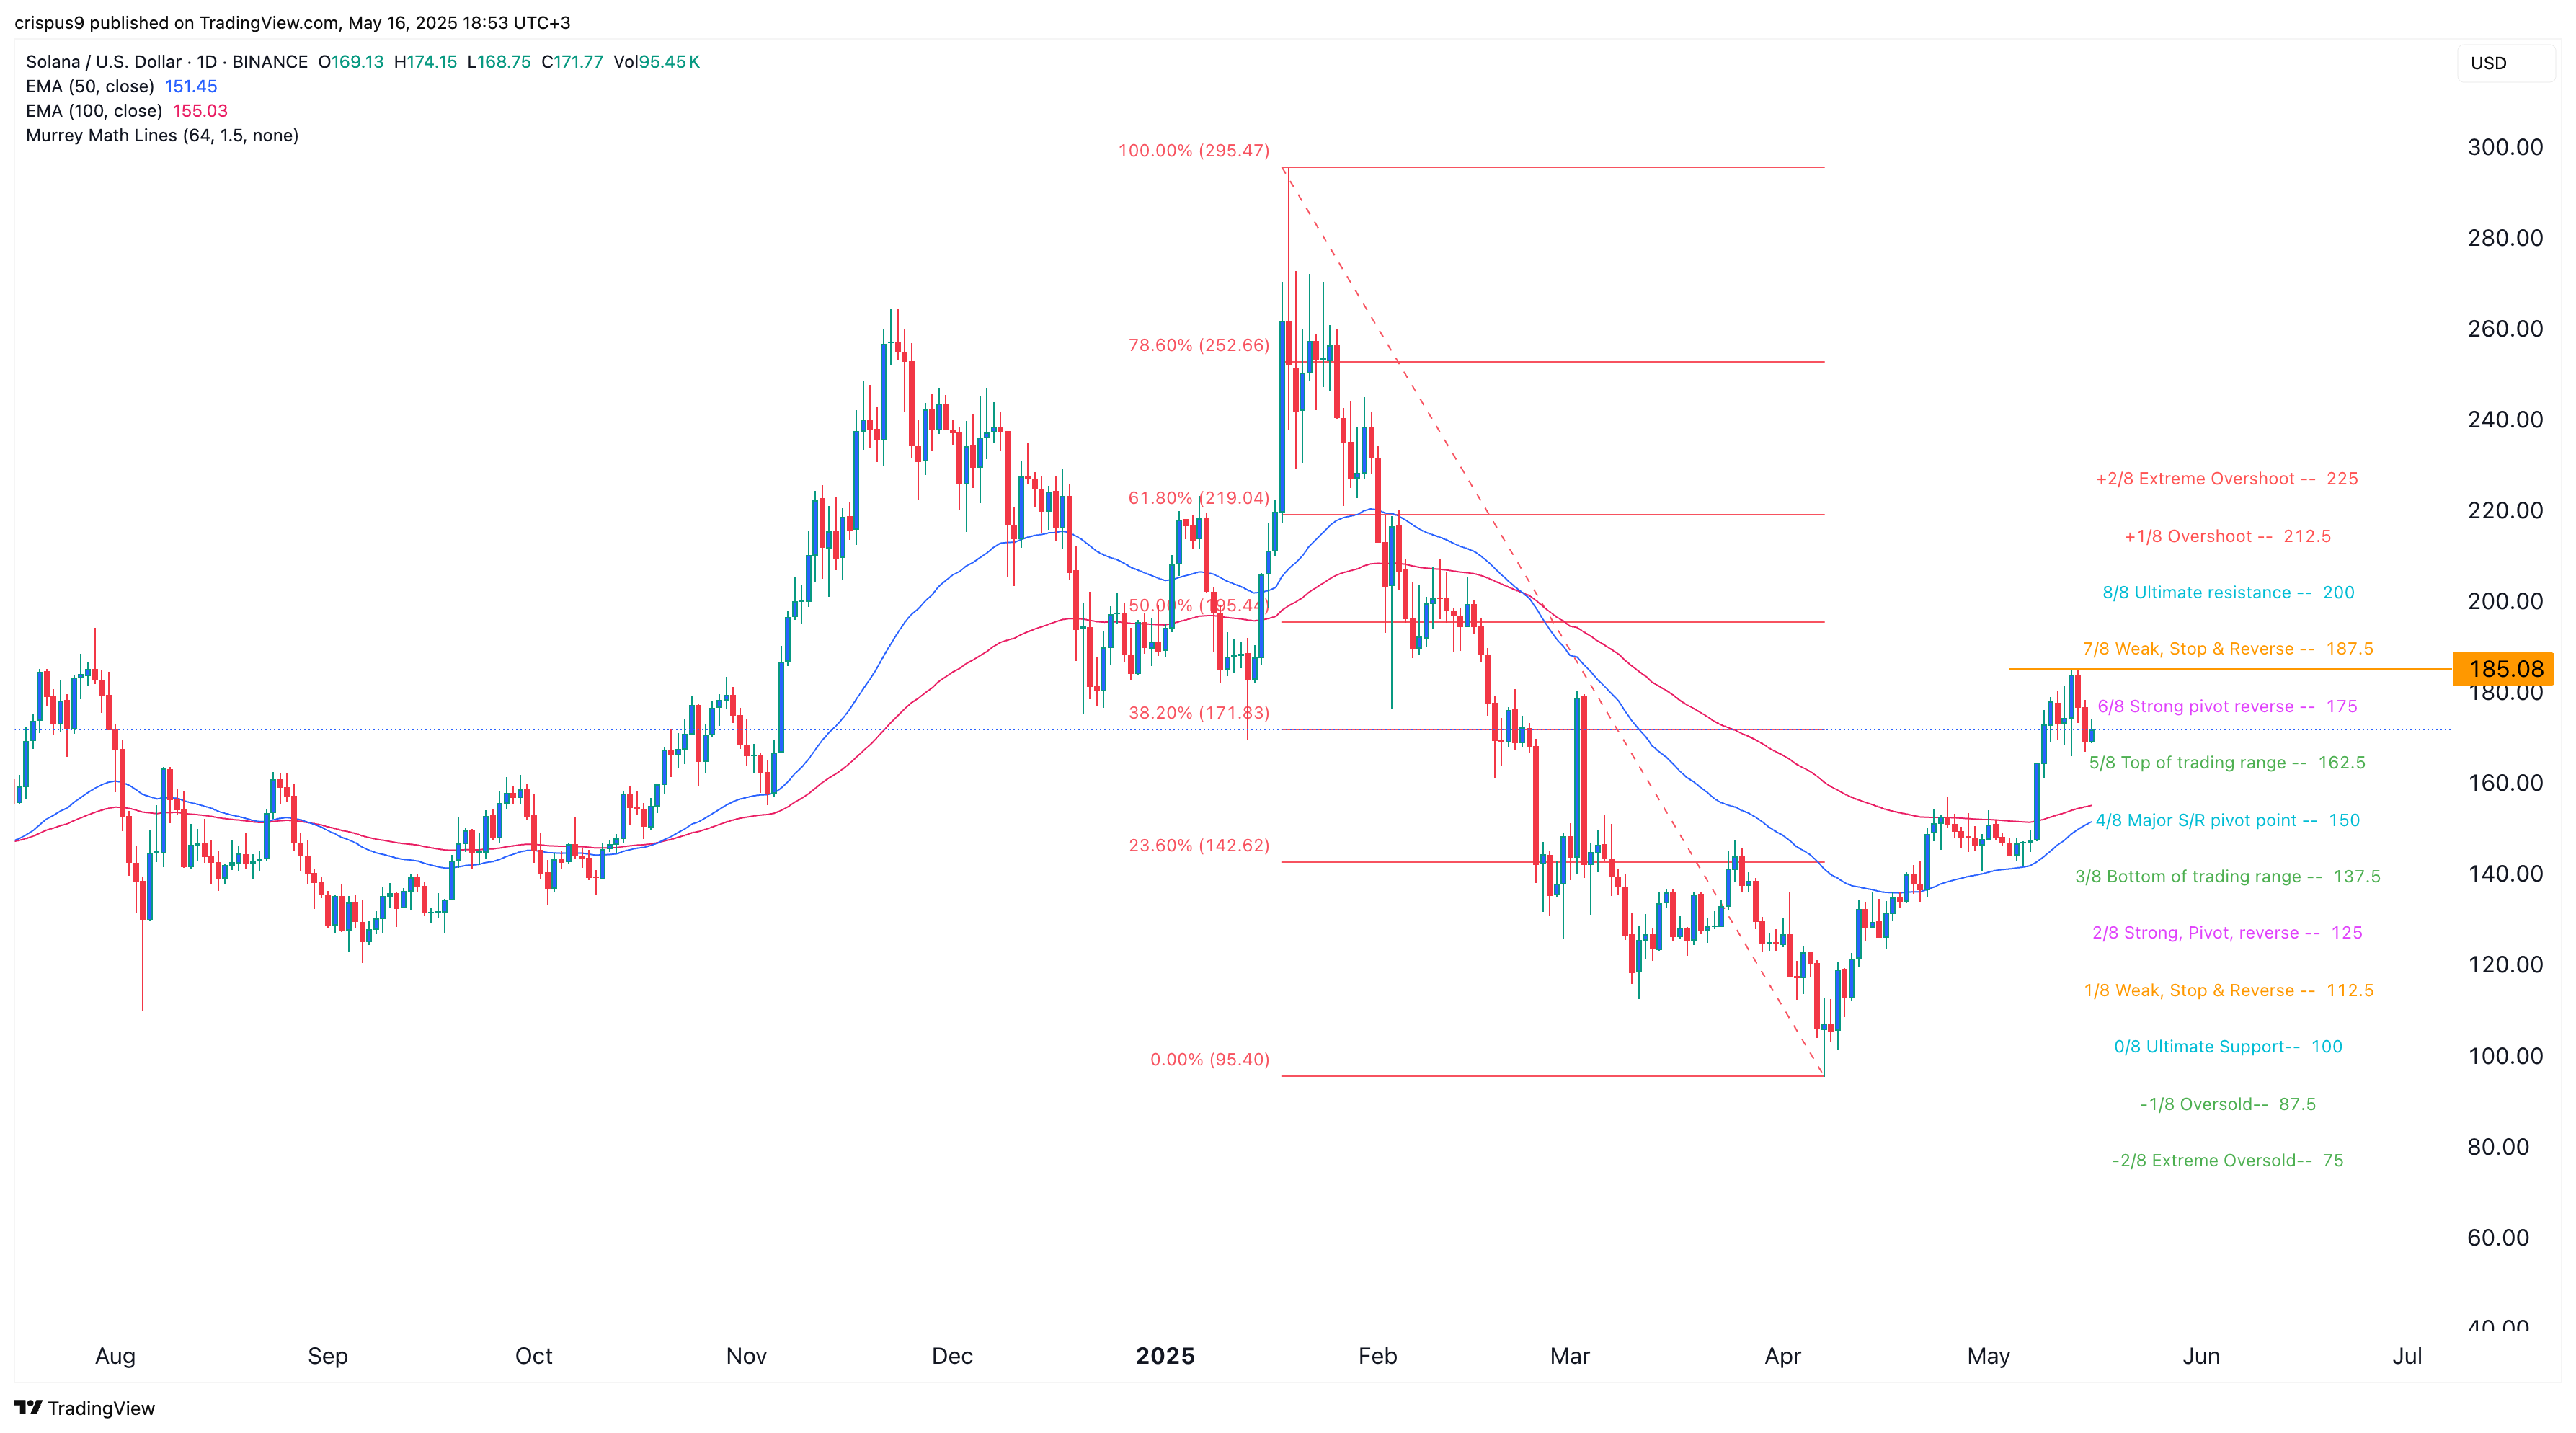
On the daily chart, Solana price has pulled back to $172 after peaking at $185 earlier in the week. It is currently hovering near the 38.2% Fibonacci retracement level. Meanwhile, the 50-day and 100-day moving averages are on the verge of forming a mini golden cross, often a bullish signal.
Solana has also formed an inverse head and shoulders pattern and is trading between the strong pivot reverse level and the upper boundary of the Murrey Math Lines trading range.
Given these technical indicators, SOL is likely to resume its uptrend, with bulls eyeing a retest of the $200 resistance level. A breakout above that level could open the path to the 78.6% Fibonacci retracement at $252. However, a drop below key support at $150 WOULD invalidate the bullish outlook.
