Solana’s $200 Lifeline: Bullish Pattern Signals Potential Rebound

Solana teeters at critical support as technical formation hints at major move
The $200 Defense Line
SOL bulls are mounting their stand at the psychological $200 barrier—a level that's separated recovery rallies from full-blown corrections throughout this cycle. The chart's developing bullish pattern suggests institutional accumulation, though whether it holds remains the billion-dollar question.
Technical Breakout Imminent
Descending wedge formation nearing completion typically precedes explosive moves. Trading volume patterns indicate smart money positioning while retail hesitates—classic accumulation behavior before major rallies. Historical data shows similar patterns preceding SOL's 2024 300% surge.
Market Sentiment Divergence
Funding rates neutralized while open interest builds—the perfect storm for volatile price action. Derivatives traders appear cautious despite the technical setup, creating potential for violent moves in either direction. Because nothing says 'stable investment' like 20% daily swings.
The Crypto Crossroads
Solana's network metrics tell a conflicting story: developer activity hits new highs while user growth plateaus. The blockchain's proving its technical merit, but adoption needs to catch up to justify current valuations. Sometimes the fundamentals matter—just ask anyone who bought the last 'this time it's different' narrative.
Solana price key technical points:=
- Major Support Zone: $200 support aligns with the 0.618 Fibonacci retracement and the Point of Control (POC).
- Bullish Chart Pattern: Price is consolidating within a falling wedge formation, typically a bullish continuation structure.
- Upside Objective: A breakout from the wedge could propel SOL toward $240 and potentially higher.
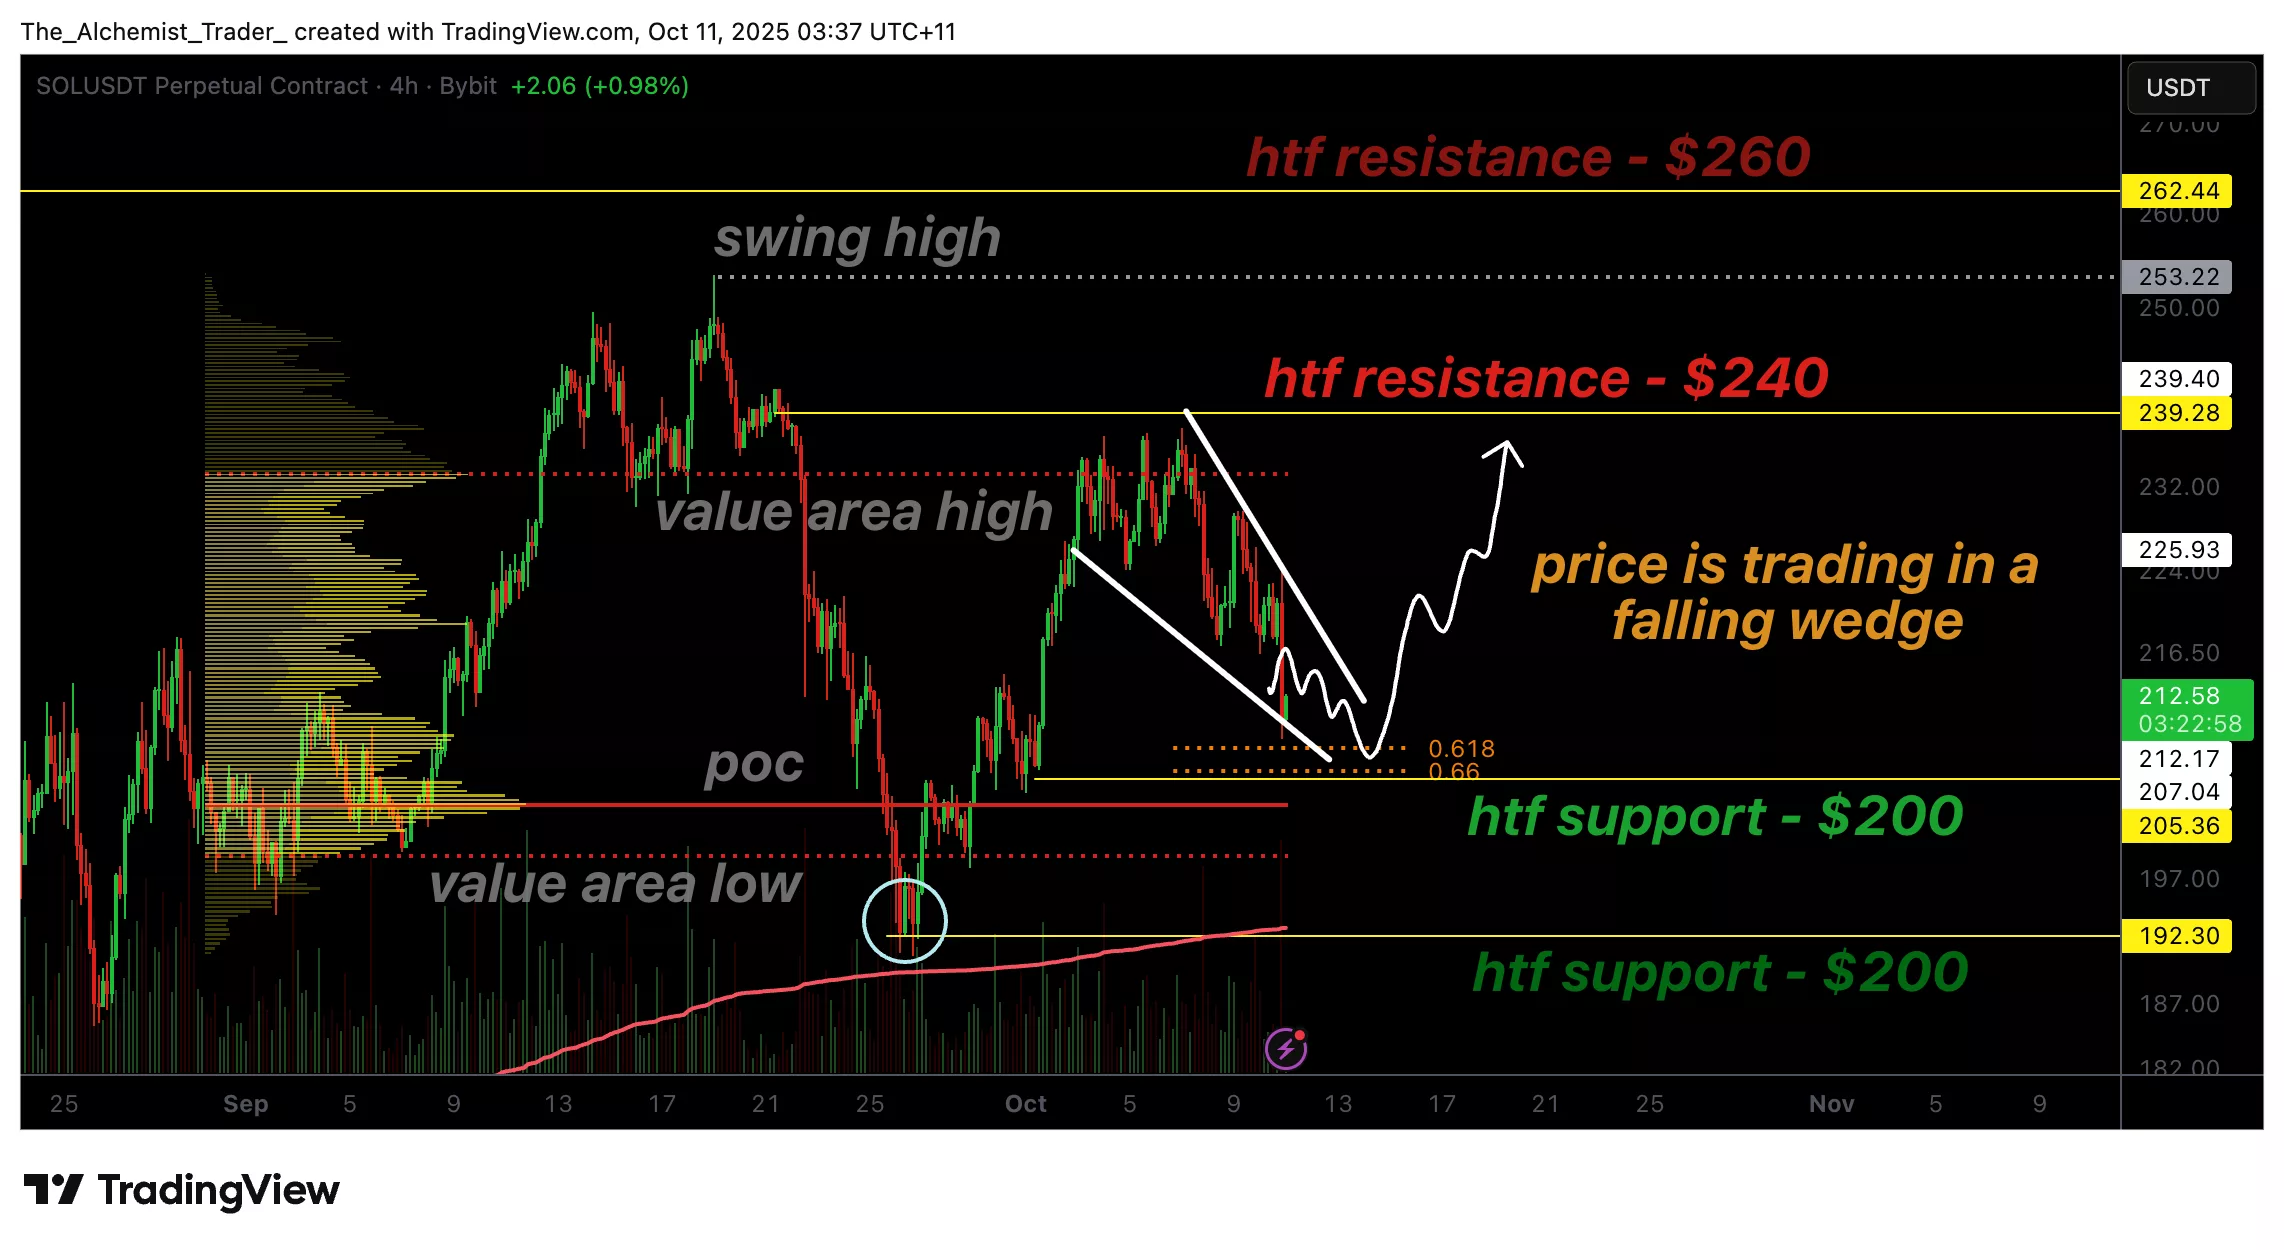
The ongoing consolidation phase in Solana’s price is forming a well-defined falling wedge pattern, with dynamic resistance and support lines converging toward an apex around the $200 region. This formation is often interpreted as a bullish continuation signal, suggesting that a breakout to the upside could be imminent once the pattern completes.
From a structural standpoint, the $200 support zone holds significant importance. It coincides with the 0.618 Fibonacci retracement level from the previous swing low, as well as the POC, the area with the highest traded volume in recent sessions. This confluence creates a dense liquidity pocket where a rotation toward higher levels could easily occur, provided that buyers maintain control.
The current market structure remains favorable for bulls, as long as daily candle closes continue to hold above $200. Should solana maintain this level and volume begin to rise, the probability of a bullish breakout increases substantially.
The first target upon confirmation of the breakout WOULD be $240, then the previous range high, followed by potential extensions toward $260 or beyond if bullish momentum accelerates.
What to expect in the coming price action
As long as Solana maintains its footing above $200, the broader bias remains bullish. The falling wedge structure suggests a high probability of an upward breakout, potentially targeting $240 in the short term. A confirmed breakout with strong volume could open the path toward higher resistance levels near $260.
