Ethereum Battles $4,300 Support as Spot ETH ETFs Bleed First Outflows in 9 Days

Ethereum faces critical technical test as institutional flows reverse
The $4,300 Support Line
Ethereum's price hovers near the crucial $4,300 level—a make-or-break zone that could determine its next major move. Market watchers hold their breath as the second-largest cryptocurrency defends this key technical threshold.
ETF Outflows Hit
Spot Ethereum ETFs recorded their first net outflows in nine consecutive days, snapping a positive streak that had buoyed sentiment. The sudden reversal signals potential cooling in institutional demand despite recent regulatory approvals.
Technical Pressure Mounts
Trading volumes spike as bulls and bears clash around the $4,300 mark. Technical analysts warn that a breakdown below this support could trigger cascading liquidations, while a successful defense might fuel the next leg upward.
Wall Street's latest crypto flirtation faces reality check—turns out even financialized digital gold can't escape the oldest rule in finance: what goes up must occasionally catch its breath.
Spot ETH ETF outflows mark a brief pause in institutional demand
According to SoSoValue data, U.S. spot Ethereum ETFs saw $8.54 million in net outflows on Oct. 9, breaking a run of steady inflows. BlackRock’s ETHA ETF still posted $39.29 million in new inflows, but withdrawals from Fidelity ($30.26 million) and Bitwise ($8.07 million) turned the total negative.
The shift came as investors rotated back toward Bitcoin (BTC), which saw nearly $198 million in inflows on the same day. Despite this pause, Ethereum ETFs have seen strong institutional interest, with net inflows of over $1.3 billion during the first week of October.
Analysts view the brief outflows as part of a normal rotation after heavy ETF accumulation earlier in the month. They expect momentum to return as key catalysts approach, including BlackRock’s staking ETF decision due by the end of October and upcoming U.S. consumer price index data that could affect risk appetite.
Ethereum price technical analysis
Ethereum’s technical setup points to a consolidating market as opposed to a declining one. The Relative Strength Index is neutral at 49, indicating balanced pressure between buyers and sellers. The MACD and momentum indicators remain positive, showing that the underlying trend is intact despite recent pullbacks.
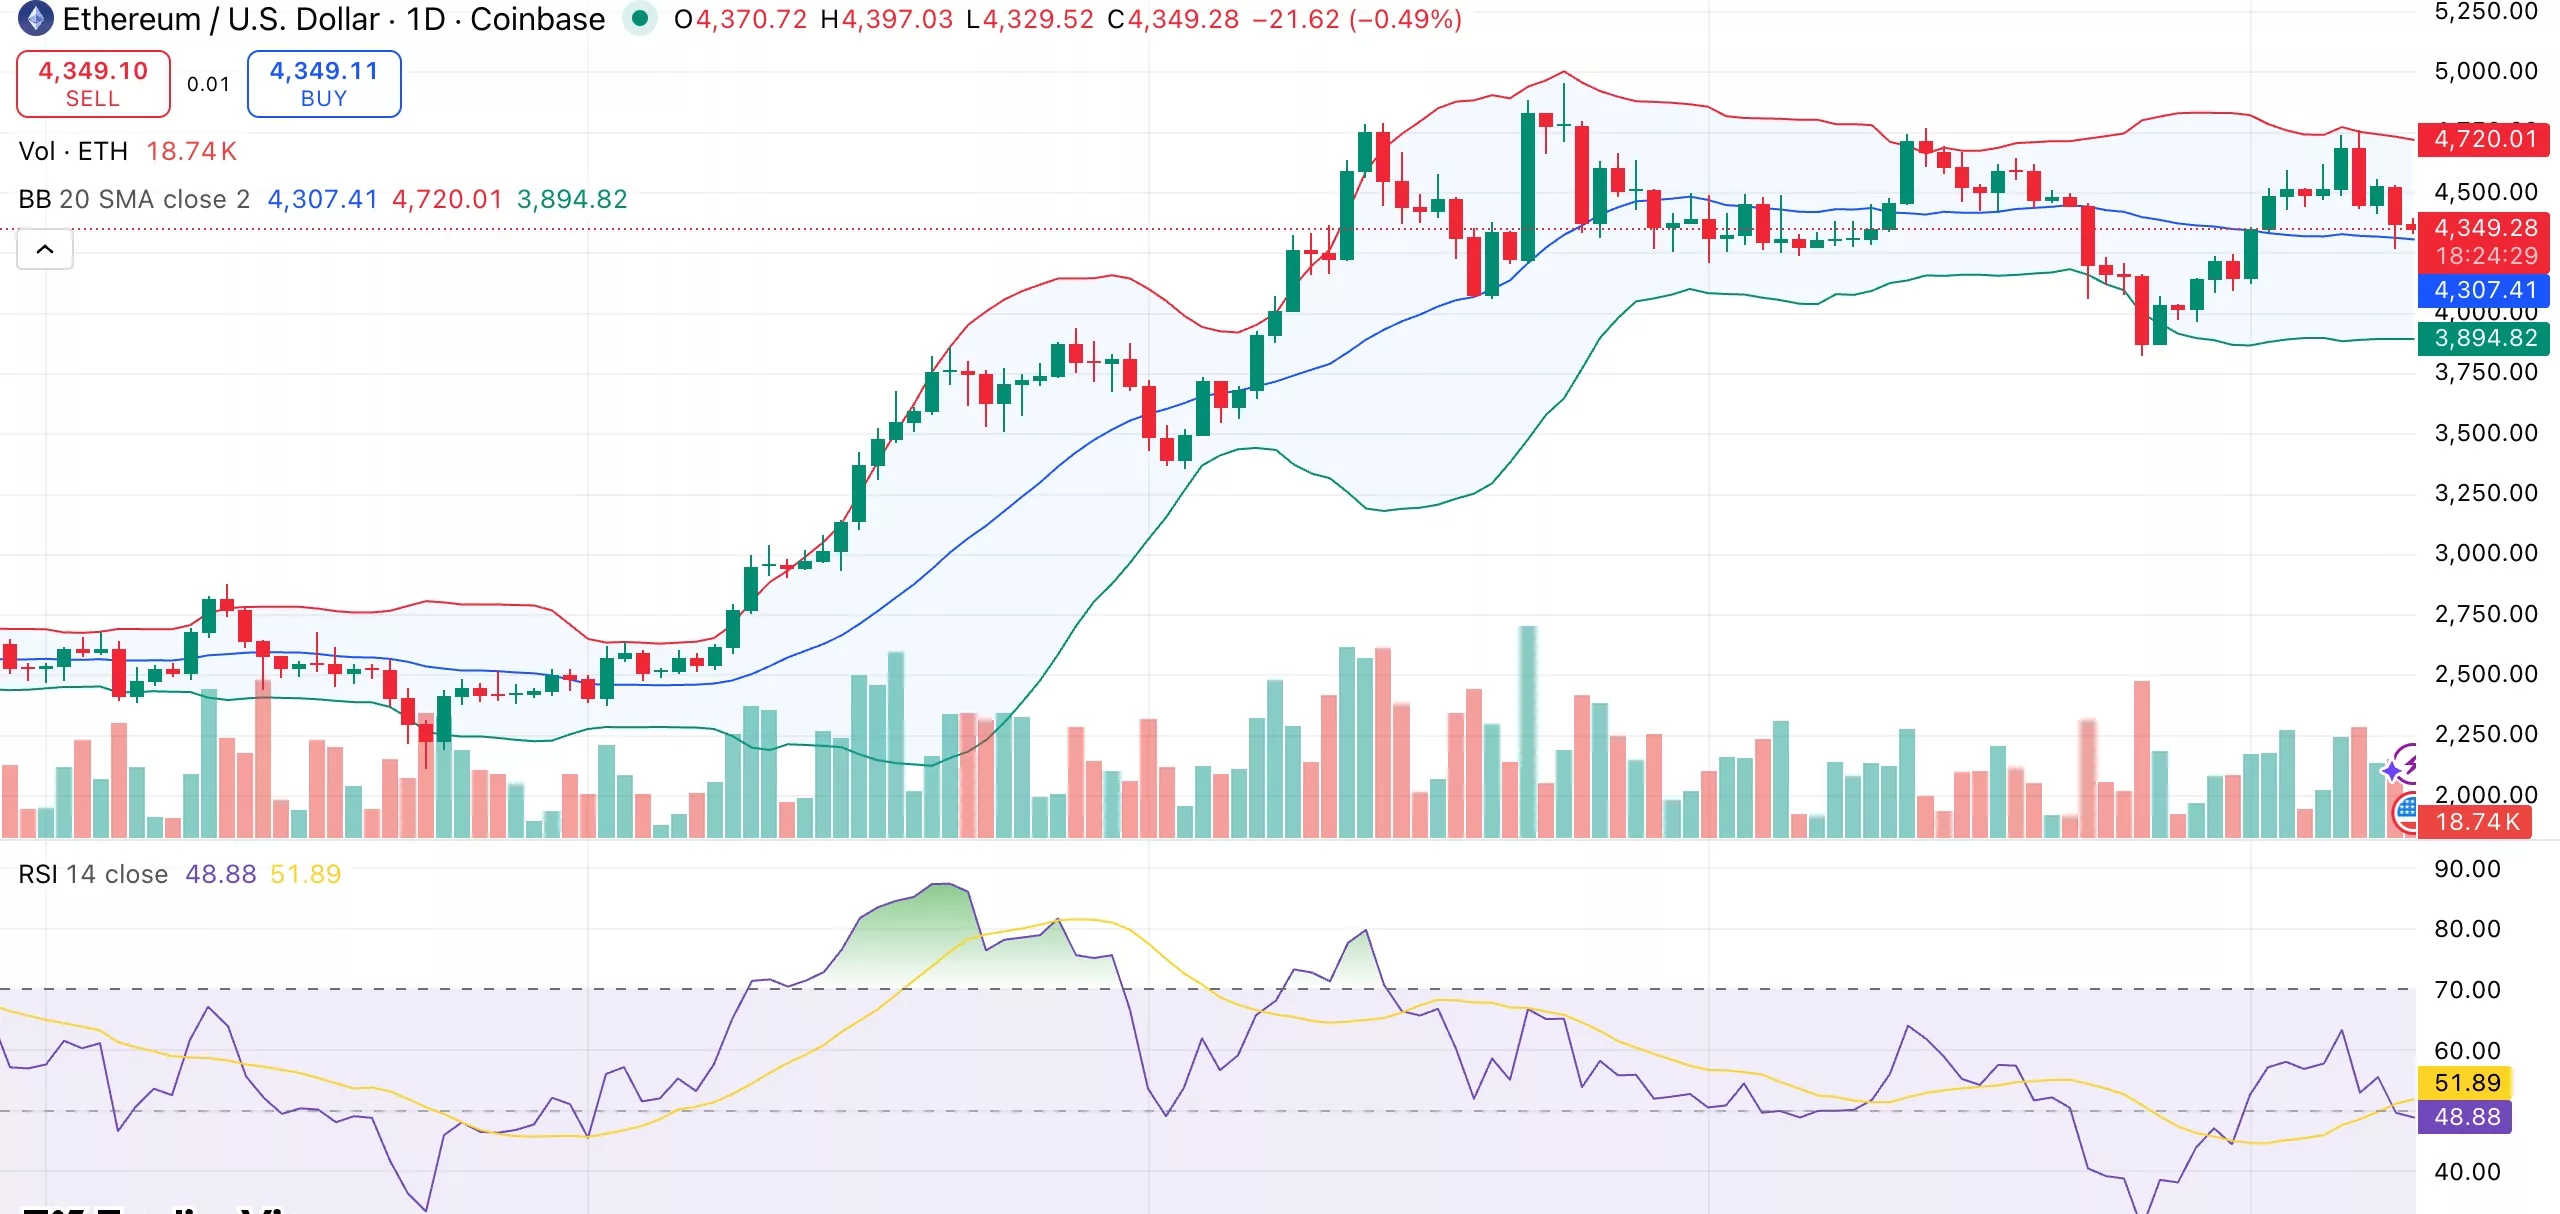
ETH is currently trading slightly below its 10- and 20-day moving averages NEAR $4,450, while its longer-term 50- and 100-day averages continue to rise, forming a support zone between $4,000 and $4,300. This implies that before another upward move, the current pullback might be a part of a larger consolidation phase.
Traders anticipate a recovery toward the $4,600 resistance level if the $4,300 support level holds. A breakout above that range could open the door to $4,950–$5,000, while a breakdown could lead to a retest of $3,900, where the next key support lies.
