Sui (SUI) Smashes Triangle Breakout—$7 Target in Sight as Bears Scramble

Sui isn’t asking for permission. The token just bulldozed through a critical triangle pattern, setting its sights on a audacious $7 target—even as the usual doom-and-gloom crowd clutches their short positions.
Technical breakout or trap?
Charts don’t lie, but crypto traders do. SUI’s surge past resistance screams bullish, but let’s see how long the ‘smart money’ stays smart before flipping bearish at the worst possible moment.
The cynical take
Wall Street would kill for this kind of volatility. Meanwhile, crypto degens yawn and buy the dip—because nothing fuels a rally like collective amnesia about last month’s 40% dump.
TLDR
- SUI surged 53% following SEC’s formal review of Canary Capital’s proposed spot SUI ETF on July 23, 2025
- Token currently trades at $3.62 after breaking out of multi-month symmetrical triangle pattern
- Exchange outflows hit $8.74 million, indicating accumulation and reduced selling pressure
- Technical indicators show mixed signals with neutral RSI at 52.91 and bearish short-term momentum
- Key resistance sits at $4.25 with support levels at $2.80 and $2.29
Sui blockchain’s native token experienced a dramatic price surge this week after the Securities and Exchange Commission began reviewing a proposed exchange-traded fund. The development marks a potential milestone for institutional crypto access.
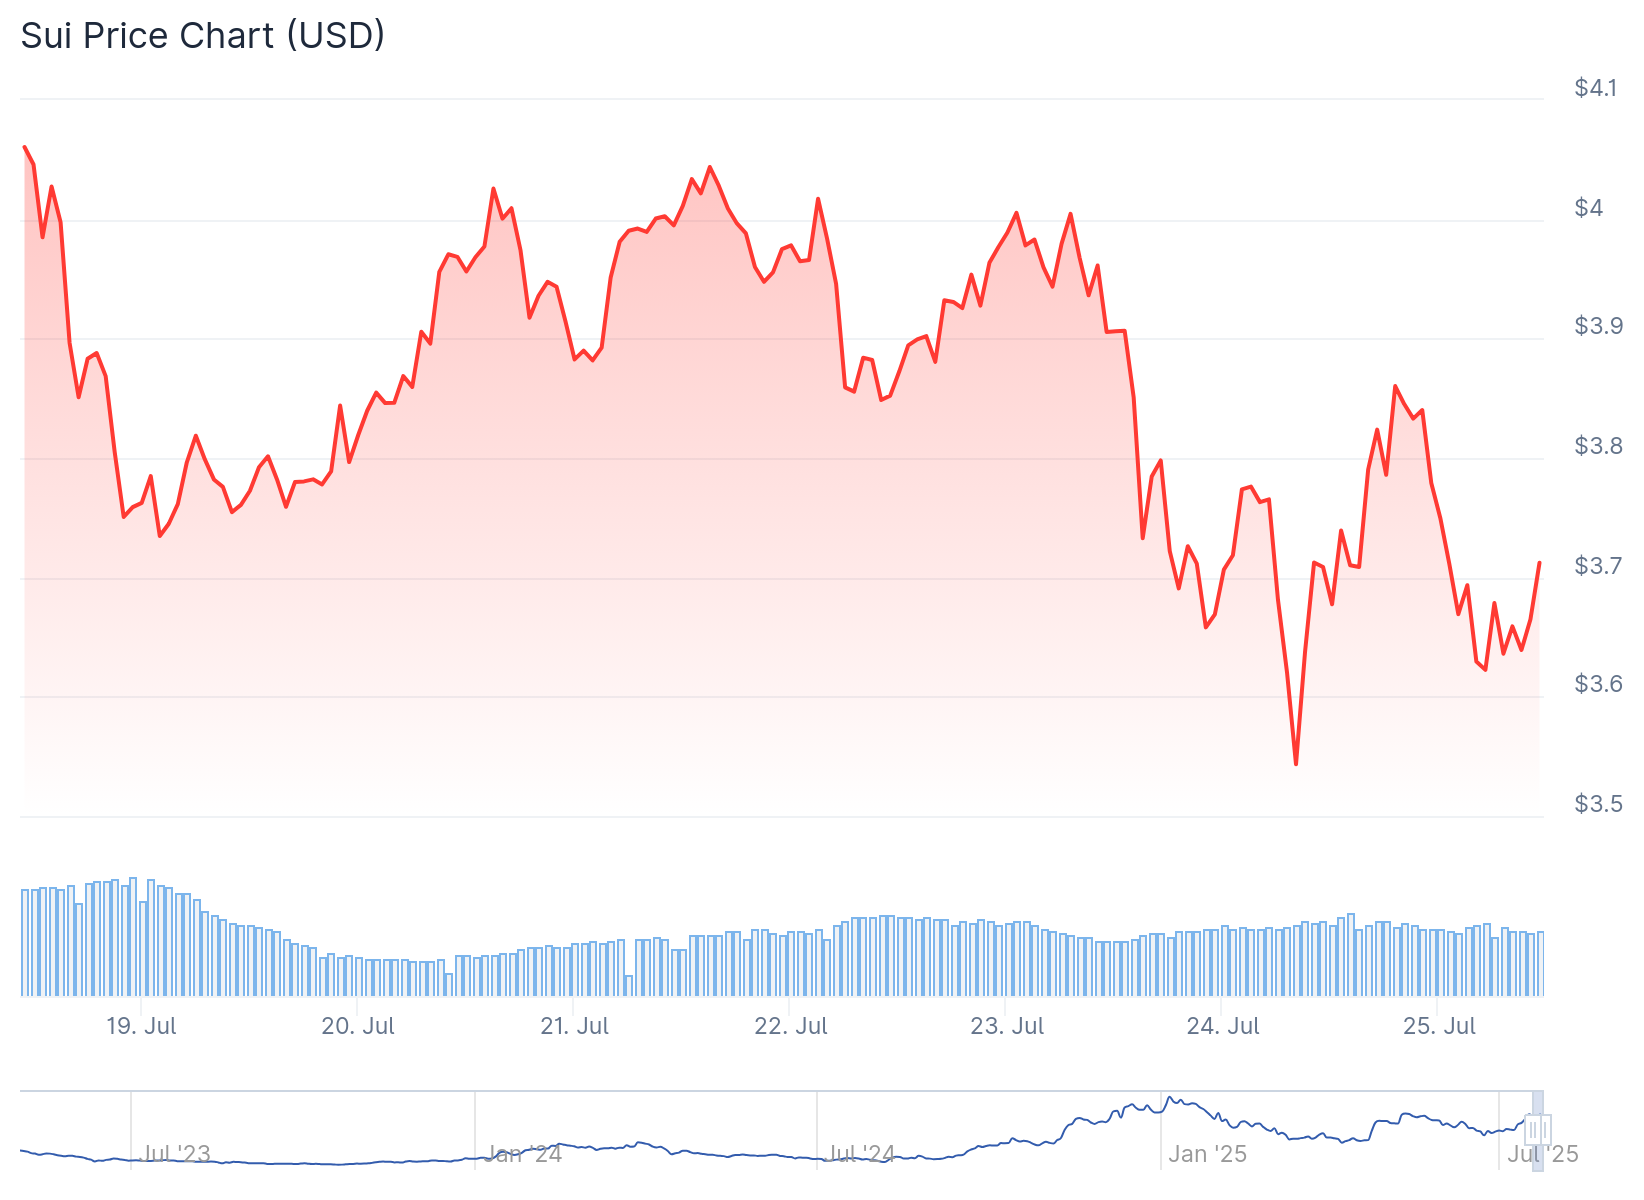
SUI price jumped 53% following news that the SEC initiated formal review of Canary Capital’s spot SUI ETF proposal on July 23, 2025. The token reached highs NEAR $4.38 before pulling back to current levels around $3.62.
The ETF review represents growing regulatory acceptance of alternative blockchain assets beyond Bitcoin and Ethereum. Market analysts view the SEC’s engagement as validation of Sui’s position as a legitimate Layer-1 blockchain project.
Technical analysis had already signaled potential upside before the ETF news broke. On July 22, analysts noted that SUI short positions were indicating a possible MOVE above $4. This contrarian signal combined with regulatory developments created conditions for the price explosion.
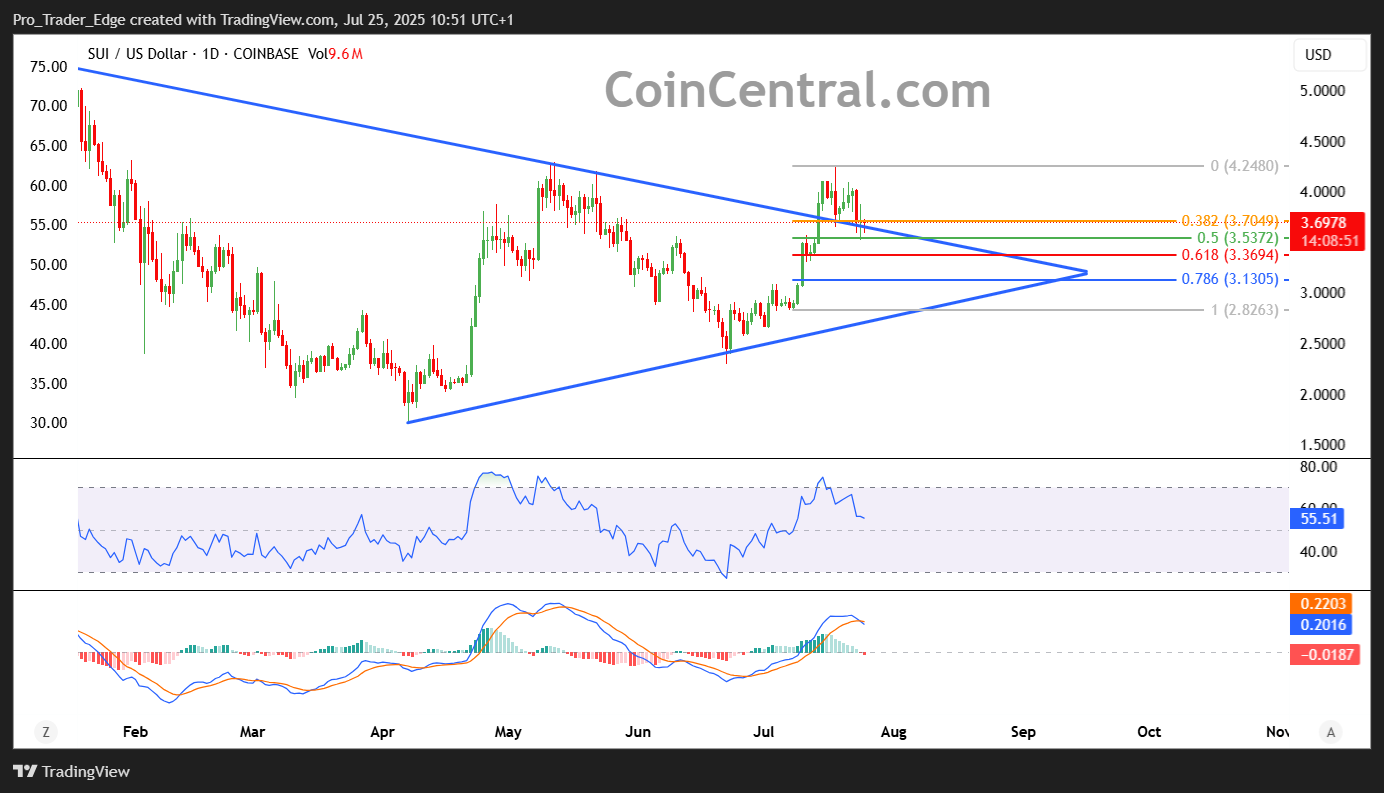
The token broke out of a multi-month symmetrical triangle pattern, which traders often associate with trend reversals. Fibonacci extension levels suggest potential upside toward $7, with the 1.618 level aligning near that target.
$SUI targets $7 after breaking out of this triangle! pic.twitter.com/O3EZjiV8SD
— Ali (@ali_charts) July 24, 2025
Exchange Data Shows Accumulation
Spot exchange data reveals net outflows of $8.74 million, reflecting declining sell-side pressure. Such negative netflows typically indicate reduced exchange reserves as investors shift toward self-custody or long-term holding.

This behavior aligns with accumulation trends and supports the breakout’s legitimacy. Historical patterns suggest sustained outflows often precede gradual price climbs toward higher resistance zones.
Current trading volume of $256.4 million on Binance spot indicates healthy liquidity for both entries and exits. This reduces execution risk for larger positions and suggests strong market participation.
The RSI currently sits at 52.91, placing it in neutral territory after cooling from overbought conditions during the rally. This reading suggests immediate selling pressure may be subsiding.
Technical Indicators Present Mixed Picture
The MACD histogram shows -0.0237, indicating bearish momentum in the short term as profit-taking occurs. However, the overall MACD remains positive at 0.1952, suggesting the broader uptrend stays intact despite current consolidation.
Sui’s position within Bollinger Bands shows the token trading at 0.5117 of the band width. This middle-range position indicates neither extreme fear nor greed, offering a more balanced entry point compared to recent highs.
Immediate resistance appears at $4.25, coinciding with both technical resistance and psychological barriers. Breaking above this level could trigger another leg higher toward the 52-week high of $5.29.
Binance’s liquidation heatmap shows dense clusters between $3.80 and $4.00, areas that recently saw increased leverage exposure. These zones often act as magnets for volatility and can provide strong resistance.
The zone saw over $3 million in long liquidations, far outweighing short positions. Reclaiming and holding above $4.00 remains essential for the breakout to maintain credibility.
On the downside, support levels appear well-defined. Immediate support sits at $2.80, representing a 22% downside buffer from current levels and aligning with the lower Bollinger Band.
The pivot point at $3.67 serves as a crucial monitoring level. Trading above this maintains the bullish bias, while a break below could signal deeper retracement toward $2.80 support.
Strong support at $2.29 represents a critical floor, coinciding with major Fibonacci retracement levels from the recent rally. This level WOULD likely attract buying interest from both retail and institutional participants.
Despite the bullish technical setup, sentiment metrics show a different story. Weighted Sentiment dropped to -0.934, while social dominance plunged to 0.011%.
This decline suggests market participants remain skeptical of the breakout’s strength. Limited retail HYPE surrounding the rally could reduce momentum-driven buying in the near term.
However, sentiment disconnects can serve as contrarian signals. Major rallies often begin during periods of low confidence, especially when backed by solid technicals and exchange flows.
Spot Taker CVD highlighted ongoing dominance by market sellers, signaling strong taker sell activity despite recent bullish price action. Many participants continue actively offloading SUI, potentially limiting immediate upside.
The presence of aggressive sellers amid rising prices may reflect a transition phase where sellers are absorbed by high demand. Continued absorption without price rejection could validate underlying strength.
The SEC review process could take months, creating potential volatility in both directions as the market awaits approval decisions.
