Cardano (ADA) at Critical Juncture: Dip Buyers Rally as Price Nails Make-or-Break Support

Blood in the streets? Smart money's loading up.
ADA bulls defend key levels—while skeptics yawn at yet another 'generational buying opportunity' in crypto.
Technical Outlook: The $0.45 zone emerges as a battleground between panic sellers and true believers. On-chain data shows whales accumulating, but retail traders still nursing PTSD from last year's 80% crash.
Market Psychology: Classic fear/greed play unfolding—just as Wall Street analysts 'coincidentally' start publishing bearish reports (while their hedge fund buddies quietly accumulate positions).
Bottom Line: This either becomes the trade of 2025...or another reminder that 'support levels' in crypto are just collective hallucinations until proven otherwise.
TLDR
- ADA retreated to $0.80 after a 15.7% surge following Grayscale’s ETF application filing on July 22nd
- The token is holding above key support at $0.74-$0.75 with technical indicators showing bullish momentum intact
- Trading volume remains elevated at $242.2 million on Binance despite the 2.77% daily decline
- Resistance at $0.94 represents the next major target, with potential for movement toward $1.00
- RSI at 60.13 shows neutral conditions with room for further upside movement
Cardano has pulled back from recent highs as traders take profits following the explosive rally triggered by Grayscale’s spot ADA ETF application. The cryptocurrency is currently trading at $0.80, down 2.77% in the past 24 hours.
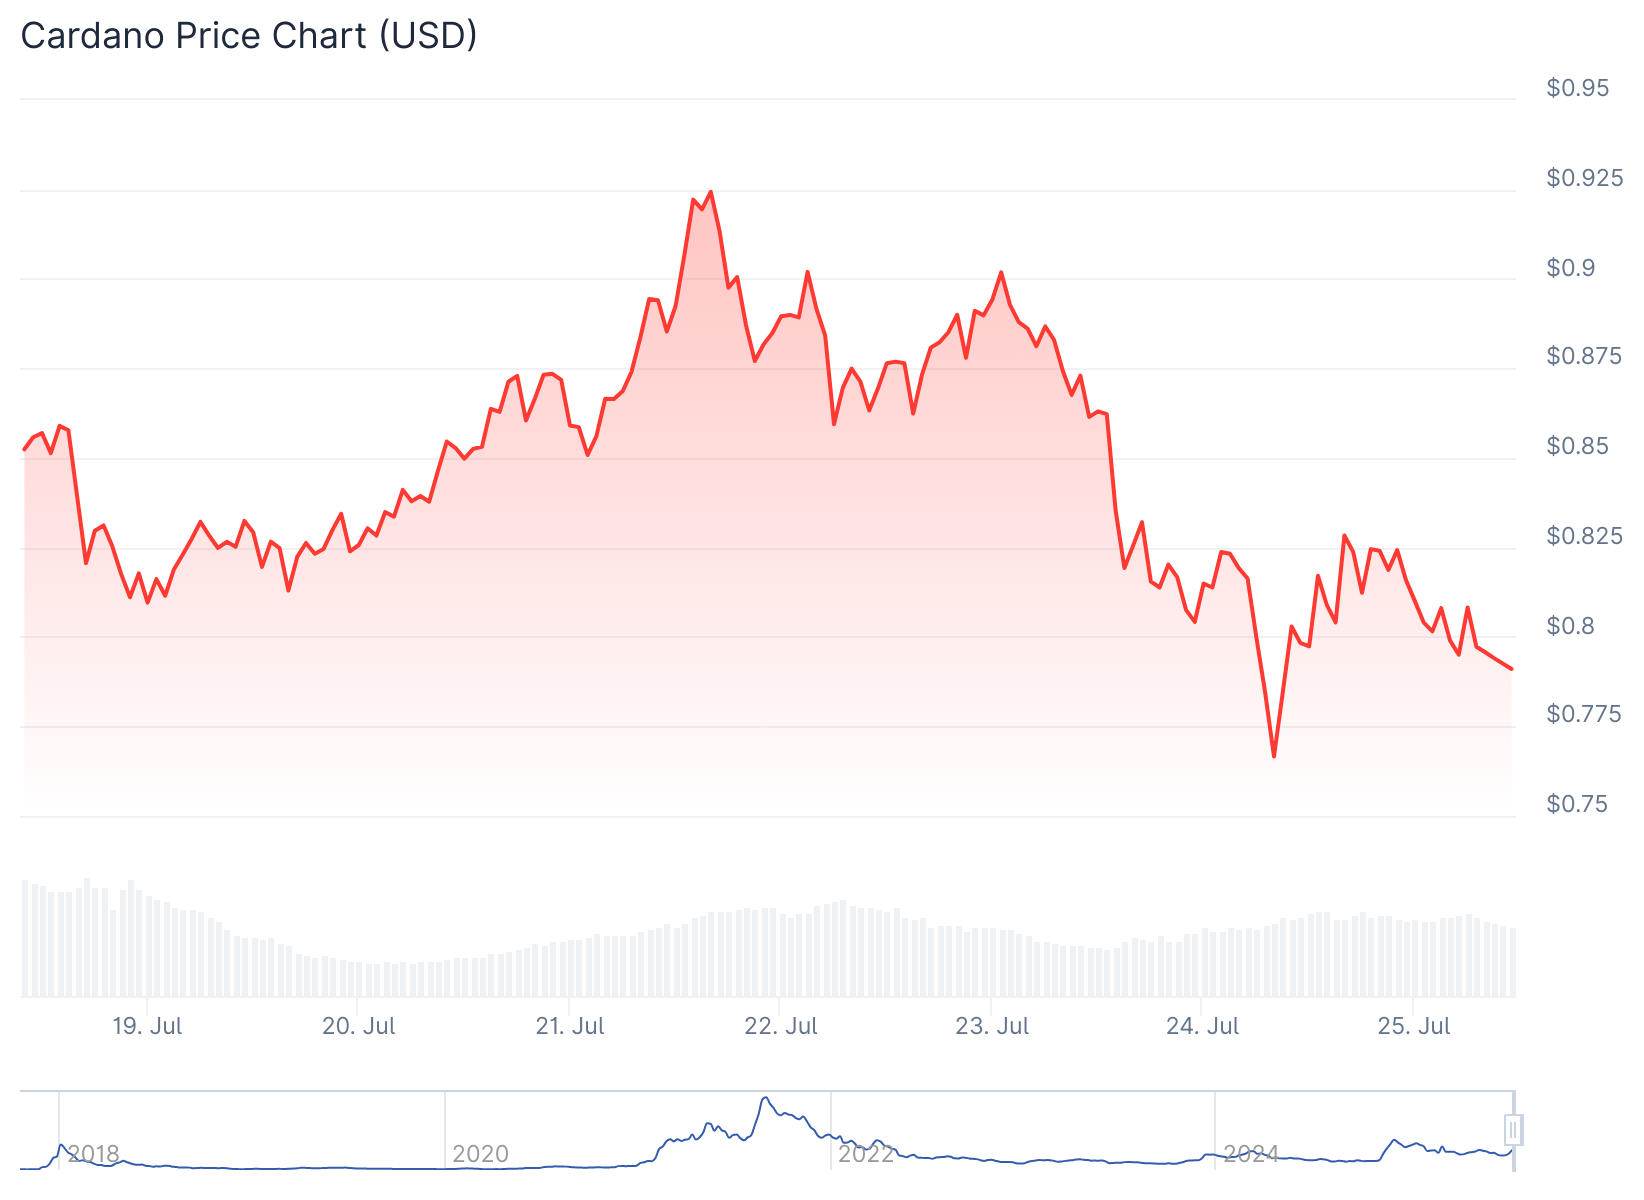
The pullback comes after ADA surged 15.7% earlier this week when Grayscale filed its ETF application on July 22nd. This correction appears healthy after Cardano reclaimed the $0.85 resistance level for the first time in months.
The recent 37% surge throughout July has fundamentally shifted ADA’s technical structure. All major exponential moving averages have flipped bullish for the first time in months, representing a departure from the compressed trading ranges that characterized earlier price action.
Technical Indicators Show Mixed Signals
Cardano’s RSI currently sits at 60.13, indicating neither overbought nor oversold conditions. This neutral reading provides room for further upside movement without immediate selling pressure from momentum indicators.

The MACD configuration displays bullish momentum with the main line at 0.0570 sitting above the signal line at 0.0542. The positive histogram reading of 0.0028 confirms that buying pressure remains intact despite today’s price decline.
ADA is trading above its 20-day simple moving average of $0.75 and well above the 50-day SMA of $0.66. The 12-period EMA at $0.80 matches the current price level while the 26-period EMA provides support at $0.74.
The Bollinger Bands show ADA positioned at 0.6323 between the bands. The upper band at $0.94 represents the next major resistance target, suggesting room for higher movement within the current volatility envelope.
Trading volume remains elevated at $242.2 million on Binance spot markets. This indicates continued institutional and retail interest following the ETF news catalyst.
Key Support and Resistance Levels
The immediate support sits at $0.74, coinciding with the 26-period EMA and providing the first line of defense for bulls. Below this level, stronger support exists at $0.57, aligning with previous resistance-turned-support levels from the July breakout.

Primary resistance faces a test at the $0.94 level, which represents both the Bollinger Band upper boundary and a psychological barrier. This level has proven challenging in recent trading sessions, with cardano facing rejection around $0.88 earlier this week.
A decisive break above $0.94 WOULD likely trigger the next leg toward the psychological $1.00 level. The current pivot point at $0.80 serves as a critical battleground for traders.
If the price turns down and breaks below the 20-day SMA, it suggests that the breakout above $0.86 may have been a bull trap. The pair could then decline to the 50-day SMA at $0.66.
The moving averages are on the verge of a bearish crossover on the 4-hour chart, indicating a comeback attempt by the bears. Recovery attempts are likely to face selling at the 20-SMA.
If buyers can drive the price above the 20-SMA, the pair could rise to $0.90 and subsequently to $0.94. The deeper any potential fall, the greater the time it would likely take for the next leg of the uptrend to begin.
For aggressive traders, the current ADA price presents an attractive entry point with favorable risk-reward ratios. Placing stops below the $0.74 support level limits downside risk to approximately 7.5%, while potential upside to the $0.94 resistance offers 17.5% profit potential.
Conservative investors might wait for a deeper pullback toward the $0.74-$0.75 range, which would provide better entry prices NEAR the 20-day moving average. Risk management remains crucial given Cardano’s Daily ATR of $0.06, indicating potential 7-8% daily moves in either direction.
