These Memecoins Plunge 9% as Price Predictions Signal Major Rally Ahead

Memecoins take a sudden dive—dropping exactly 9%—just as analysts spot bullish patterns that could trigger explosive gains.
Market Whiplash
Traders face whiplash as popular joke tokens nosedive, yet technical charts hint this might be the calm before the storm. The dip looks like a classic shakeout—weak hands exit before the real move up.
Conservative Targets, Explosive Potential
Historical parallels suggest a rally so fierce that even a $2 price tag seems modest. Past cycles show memecoins don’t just bounce—they moon. This isn’t hope; it’s pattern recognition.
Timing the Rebound
Smart money isn’t panicking—it’s accumulating. While traditional investors debate P/E ratios, crypto degens trust the charts. One thing’s clear: when memecoins move, they move fast.
If you can handle a 9% drop, you might just catch a 900% pump. Then again, if you can’t—maybe stick to bonds and slow, predictable disappointment.
Meme Coin Rally Setup: Dogecoin Price Prediction, Shiba Inu Forecast, Pepe Outlook

1. Dogecoin Price Prediction Targets $0.311 Rally
The Dogecoin price prediction shows bulls positioning for a significant rally toward $0.311 after breaking above a symmetrical triangle pattern on September 8. This memecoin rally setup actually generated a 20% surge over five days before Monday’s 4% correction brought DOGE down to around $0.269, and at the time of writing, it’s trading in that range.
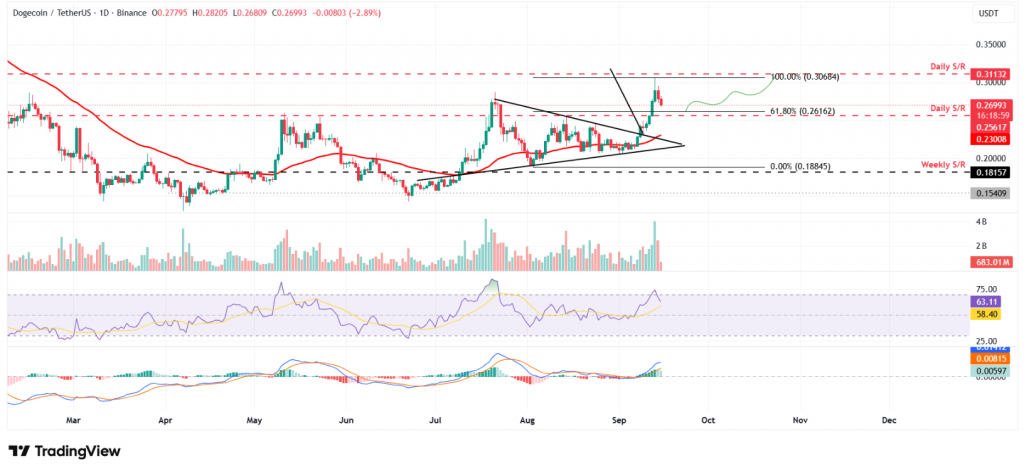
Sideline investors can accumulate Doge at the daily support level of $0.256, with the Relative Strength Index currently sitting at 63, which indicates there’s still room for upward movement. The Moving Average Convergence Divergence exhibited a bullish crossover last week with rising green histogram bars, and this supports the continuation of the upward trend even after the recent pullback.
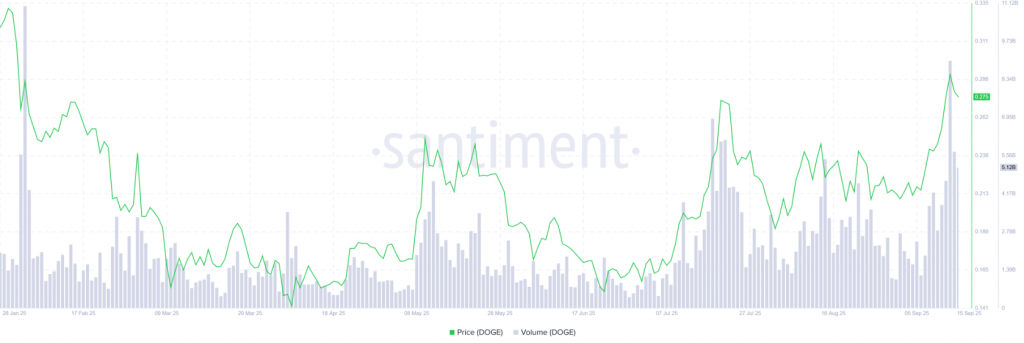
Santiment data reveals that DOGE ecosystem trading volume reached $9.02 billion on Saturday, which was actually the highest level since early February, indicating a surge in traders’ interest and liquidity in the ecosystem.
2. Shiba Inu’s Forecast Shows Triangle Breakout Potential
The shiba inu forecast reveals the token is being traded within a symmetrical triangle pattern, and this suggests the memecoin rally setup could produce some significant gains ahead. SHIB closed above the 50-day Exponential Moving Average on September 8 and rallied 12% until Saturday before facing rejection at the upper triangle trendline, which caused a decline of 4.27% on Sunday.
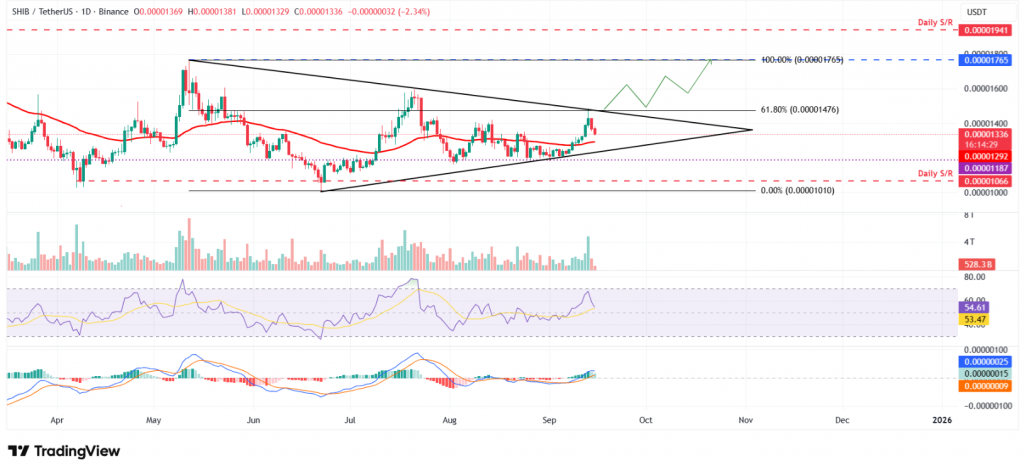
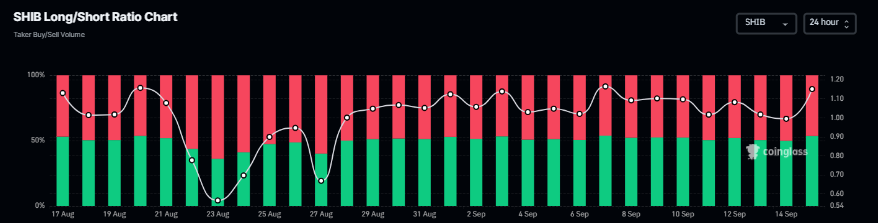
Should SHIB be supported at the 50-day EMA of 0.0000129, the dogecoin price prediction model indicates that the first objective should be the 61.8% Fibonacci retracement at 0.0000147. On Monday, Coinglass long to short ratio of SHIB was at 1.11 which was in fact the highest in about a month indicating the bullish mood among the traders.
3. PEPE’s Coin Outlook Confirms Wedge Breakout
The Pepe coin outlook strengthens as the token broke out of its falling wedge pattern on Thursday, rallying over 11% in two days after the breakout. This memecoin rally setup positioned PEPE for potential gains toward daily resistance at $0.0000124, and there are accumulation opportunities between $0.0000107 and $0.0000105 right now.
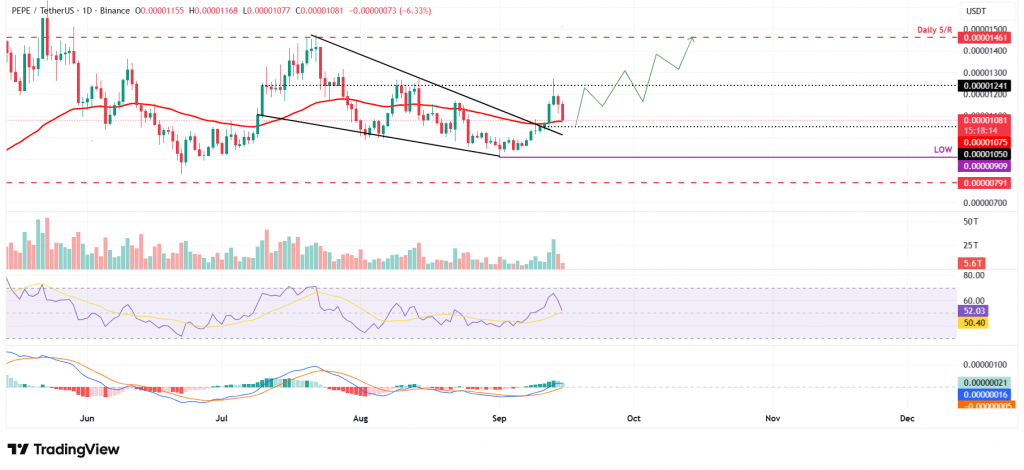
The Shiba Inu forecast methodology also applies to PEPE’s technical indicators, with RSI and MACD both supporting the bullish view at the time of writing. However, if PEPE closes below daily support at $0.0000105, the decline could actually extend toward the September 1 low at $0.0000090, which would invalidate the current setup.
The memecoin search interest reflects growing attention to these setups, with each token’s Dogecoin price prediction, Shiba Inu forecast, and PEPE coin outlook pointing to rally potential despite Monday’s corrections and the recent pullbacks across the sector.
