Ethereum (ETH) Stalls at Critical Juncture: Market Holds Breath for Next Big Move

Ethereum grinds to a halt—traders eye the charts as volatility compresses to breaking point.
The Great Pause
ETH's momentum flatlines just below key resistance levels. No dramatic plunges, no explosive rallies—just the eerie calm before whatever storm comes next. Trading volumes dip as institutional money plays wait-and-see. Retail? They're scrolling through memes, hoping for a signal.
Technical Tightrope
Bollinger Bands squeeze. RSI lingers near neutral. Every candle feels like a staredown between bulls and bears—neither side blinking. Support holds… for now. Break below, and it's a slide toward liquidation city. Break above? A rally back toward glory. Simple, brutal, and utterly predictable—like Wall Street betting on both red and black.
The Catalyst Question
What shakes ETH out of its slumber? A macro surprise? A protocol upgrade whisper? An Elon tweet from a bathroom at 3 AM? Nobody knows—and everybody's pretending they do. Classic finance: overconfident forecasts backed by hope and caffeine.
Ethereum isn't dead—it's loading. Next move defines the narrative.

- Ethereum (ETH) has now been stagnant due to various reasons. This indicates that the coin can have a potential breakout or even breakdown.
- Traders are also keeping a close eye on the token assets due to the ETH spot ETFs, after the approval from the side of SEC.
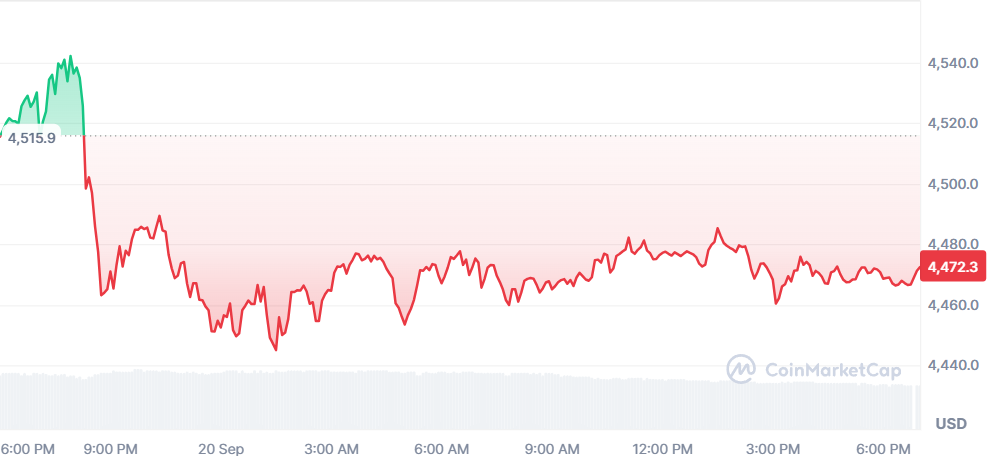
Ethereum (ETH), the second-largest cryptocurrency, is now stagnant due to various reasons. Traders are expecting a breakout or breakdown. At the time of writing, the coin is trading at $4,470.56 (1.42%), with a market capitalization of $539.67 billion. The altcoin has a volume of $24.95 billion.
Technical Indicators and Social Sentiments of Ethereum
According to the data provided by Trading View, ETH is experiencing resistance (blue) at $ 4,511.50 and can potentially rise to $ 4,600 if it rises further up. The support line of the coin is at $4,346.18 and can dip to $4,300 if it goes beyond the level.
The moving average indicator shows a bearish trend for the coin since the MA line is above the candlesticks. The Moving Average Convergence Divergence indicator also shows that the coin is experiencing a bearish momentum since the signal line (orange) is above the MACD line (blue). This indicates that the coin can have a potential breakout or even breakdown.
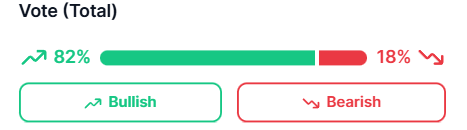
According to data given by CoinMarketCap, 82% of traders believe in bullish momentum for the coin. The rest 18% think that the coin might come down with a bearish trend. This can be due to various macroeconomic factors or technical indicators.
Macroeconomic Factors and ETF Rumors in Focus
The larger cryptocurrency market is still highly volatile, towards macroeconomic events like the Federal Reserve’s interest rate and the power of the U.S. dollar. Traders are also keeping a close eye on the token assets due to the ETH spot ETFs, after the approval from the side of SEC.
As the week comes to an end, neither bulls nor bears can control the coin fully. Traders are keen on keeping track of technical signals and other major events regarding the cryptocurrency.
